Visualizations of our conversations

This week I bestow upon you, through an abundance of my well-established generosity, a series of maps offering different perspectives on the American experience. As you would therefore expect, we will begin with a map of Montreal.
Chapter 1
What what we sound like looks like
There was a brief, unhappy period a few years ago when it seemed as though giant tech firms were succeeding in forcing all creativity onto their platforms. They still may, of course — billions of dollars generates a lot of gravitational pull — but the revival of simple website creation systems and an explosion of creative tools has led to a resurgence in bespoke sites sharing unique and interesting work.
Like that of Jeff Allen, data visualization lead at the University of Toronto's School of Cities.
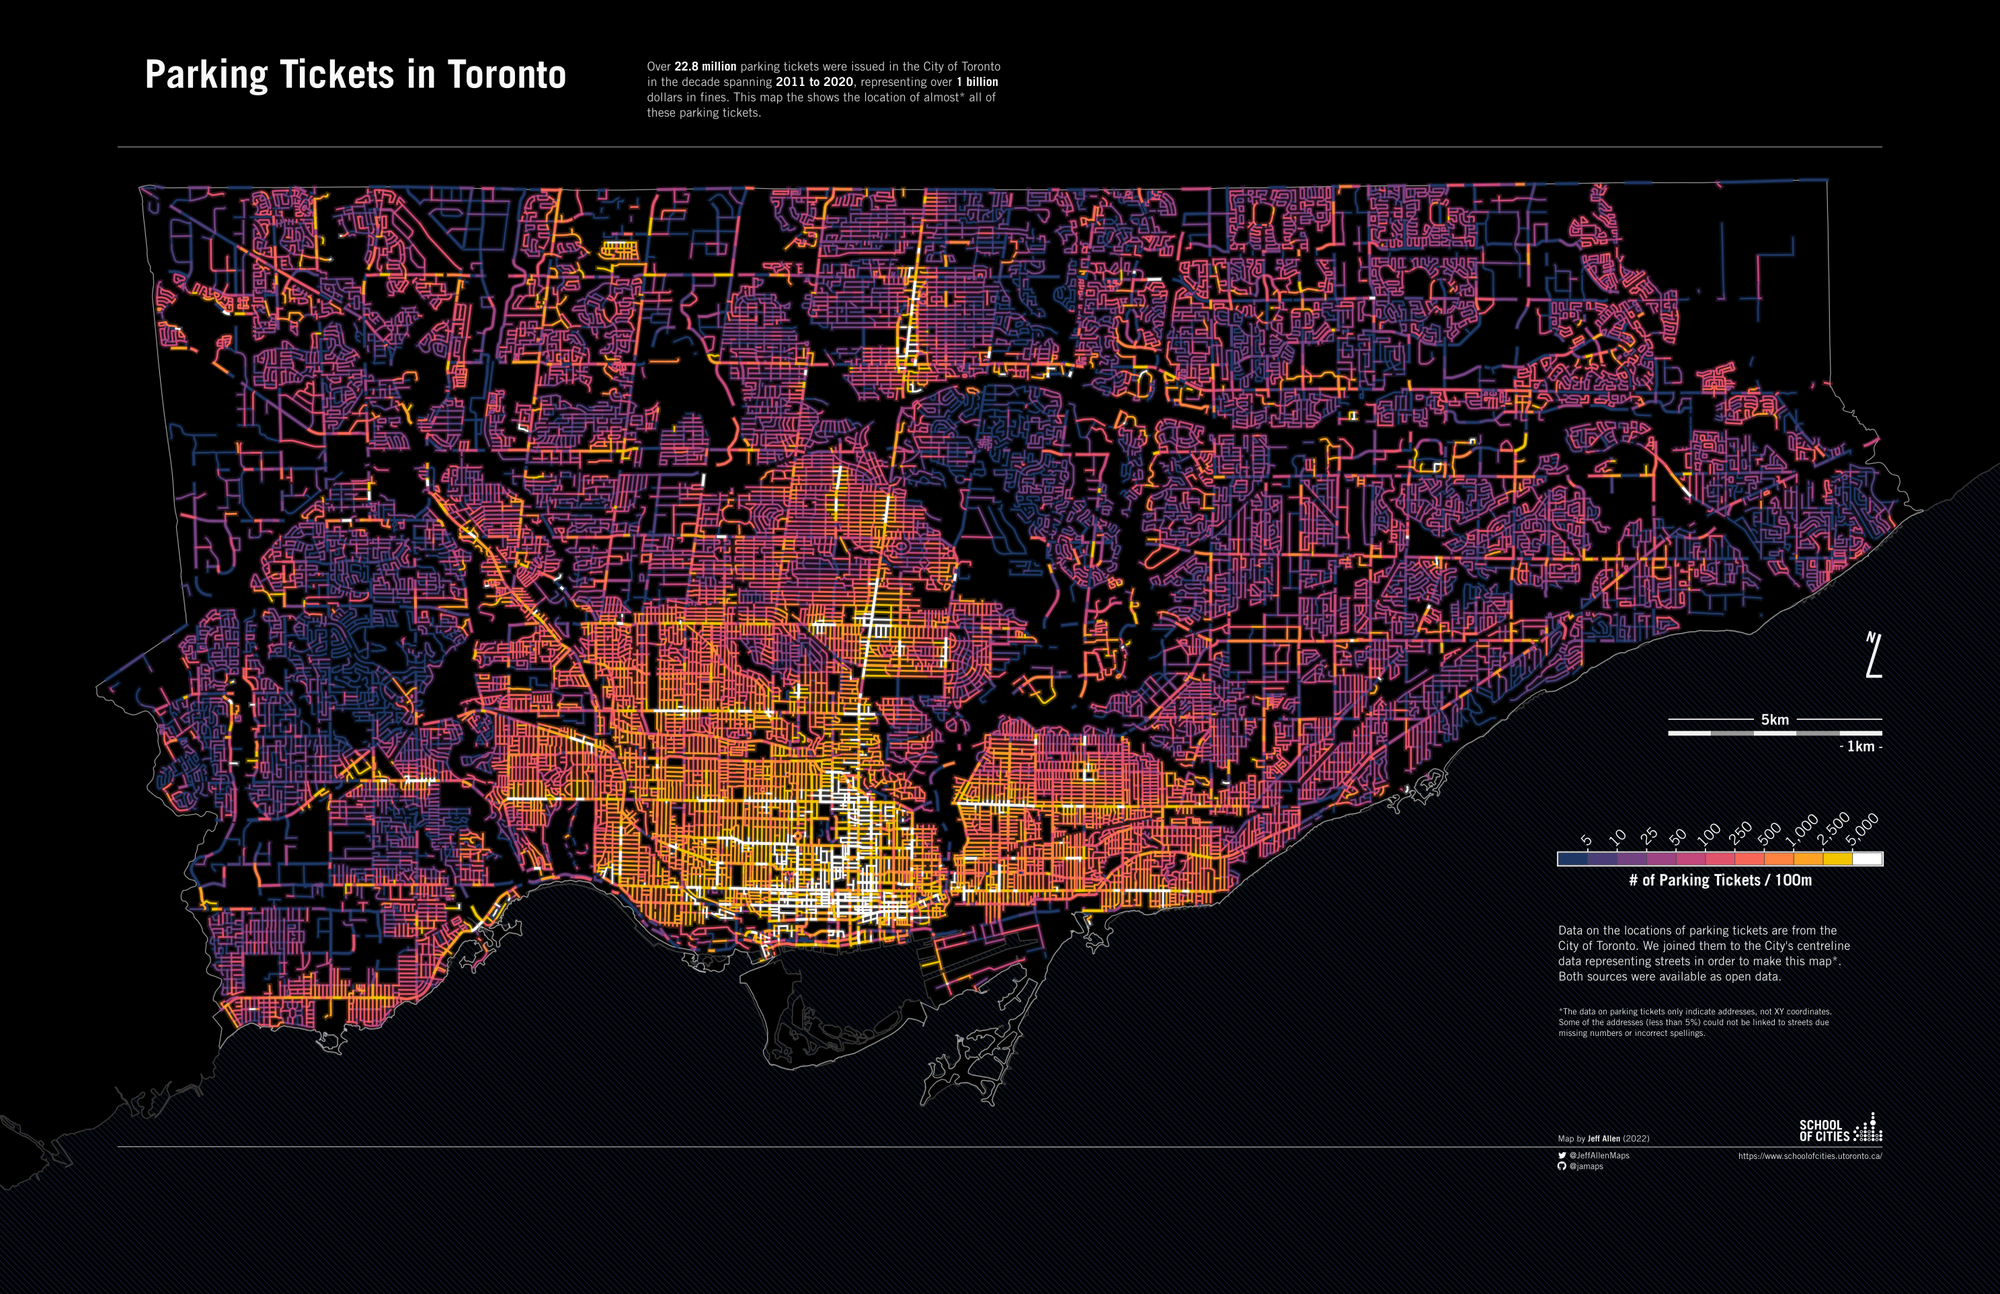
In the prior iteration of this newsletter, I shared his map of parking-ticket-density in Toronto — a visualization that tells you an awful lot about how the city flows at a glance.
This week, another of Allen's projects caught my eye. This one shows Montreal; specifically, its population distribution and the division between more-English and more-French speaking areas. All the blue depicts mostly French parts of the city; the red depicts mostly English ones.
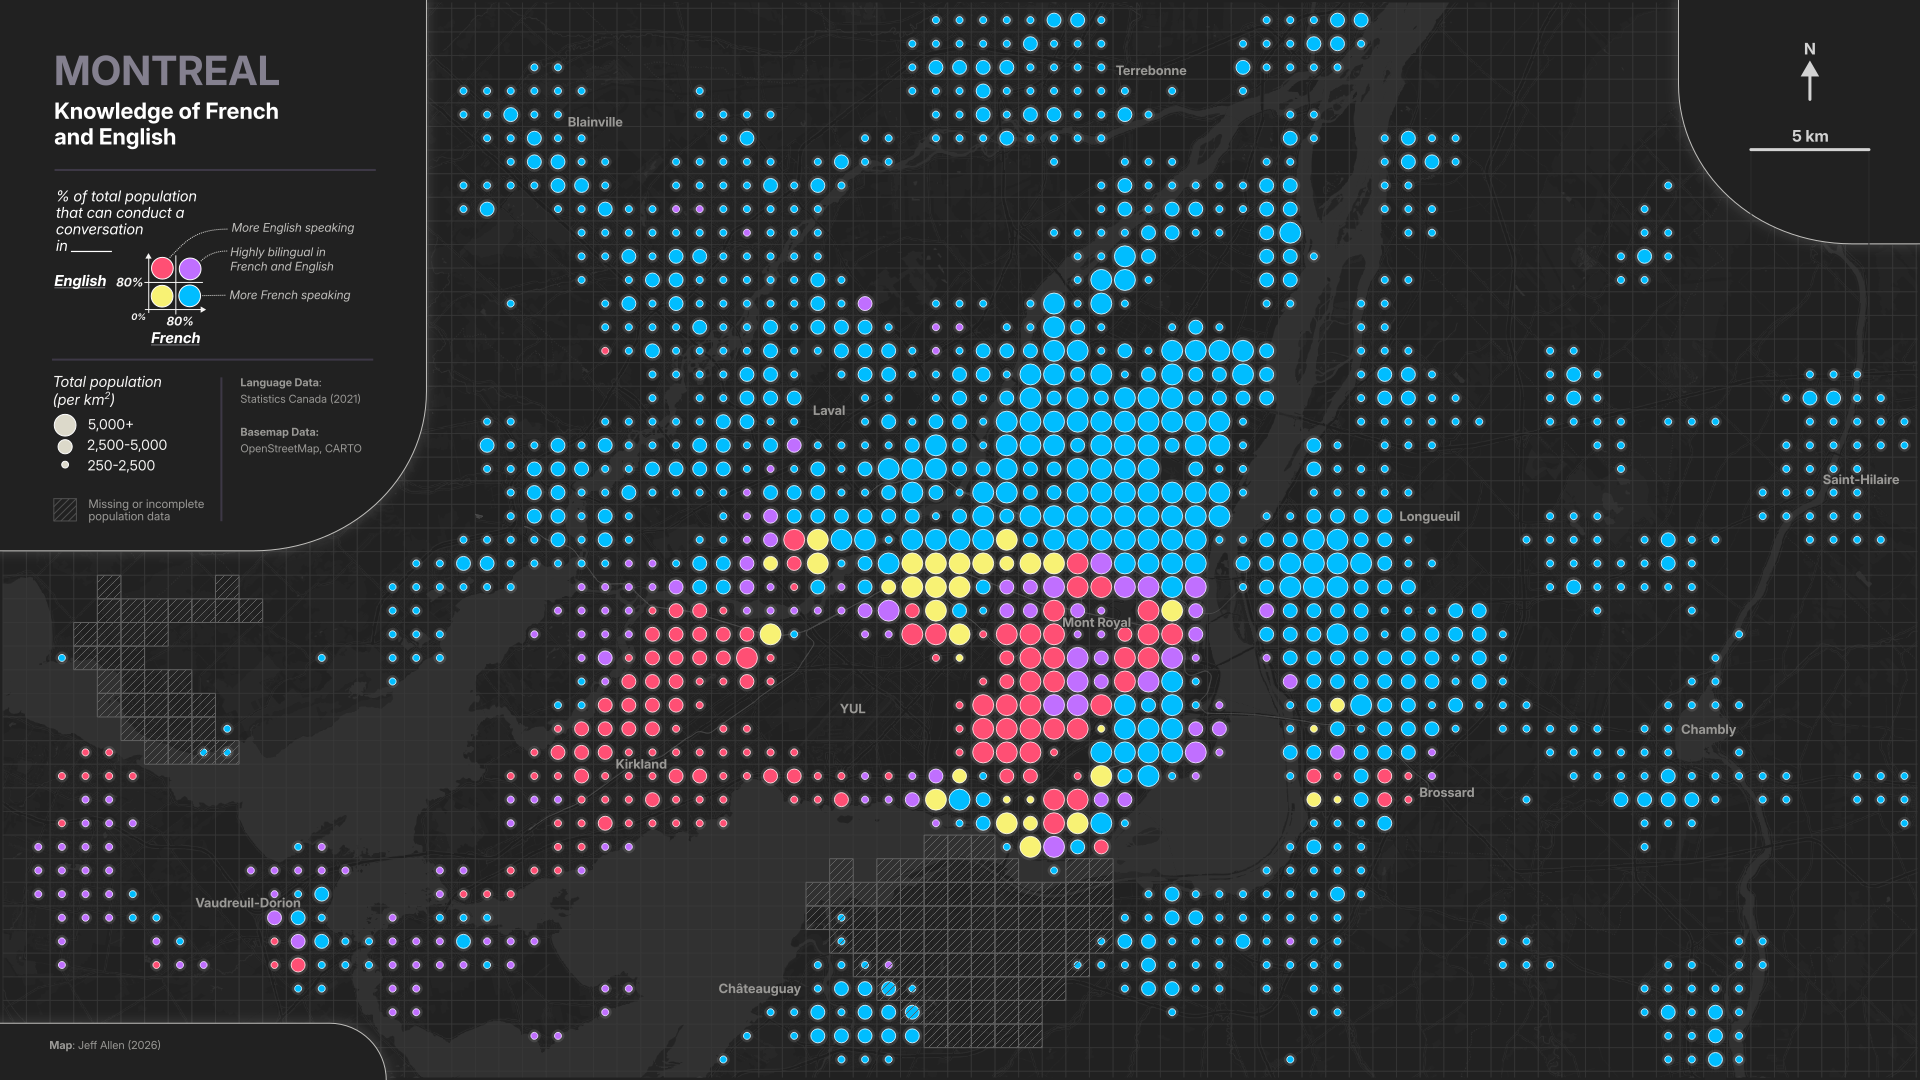
Over email, Allen highlighted a particularly interesting finding that emerged from the design process: all of those yellow areas, places where English and French are both relatively less common. This, he noted, "approximately correlates to recent immigrant settlement patterns."
Inspired by Allen's work, I decided to try to recreate it. Using data on language prevalence compiled by the Census Bureau, I created the map of New York City below.
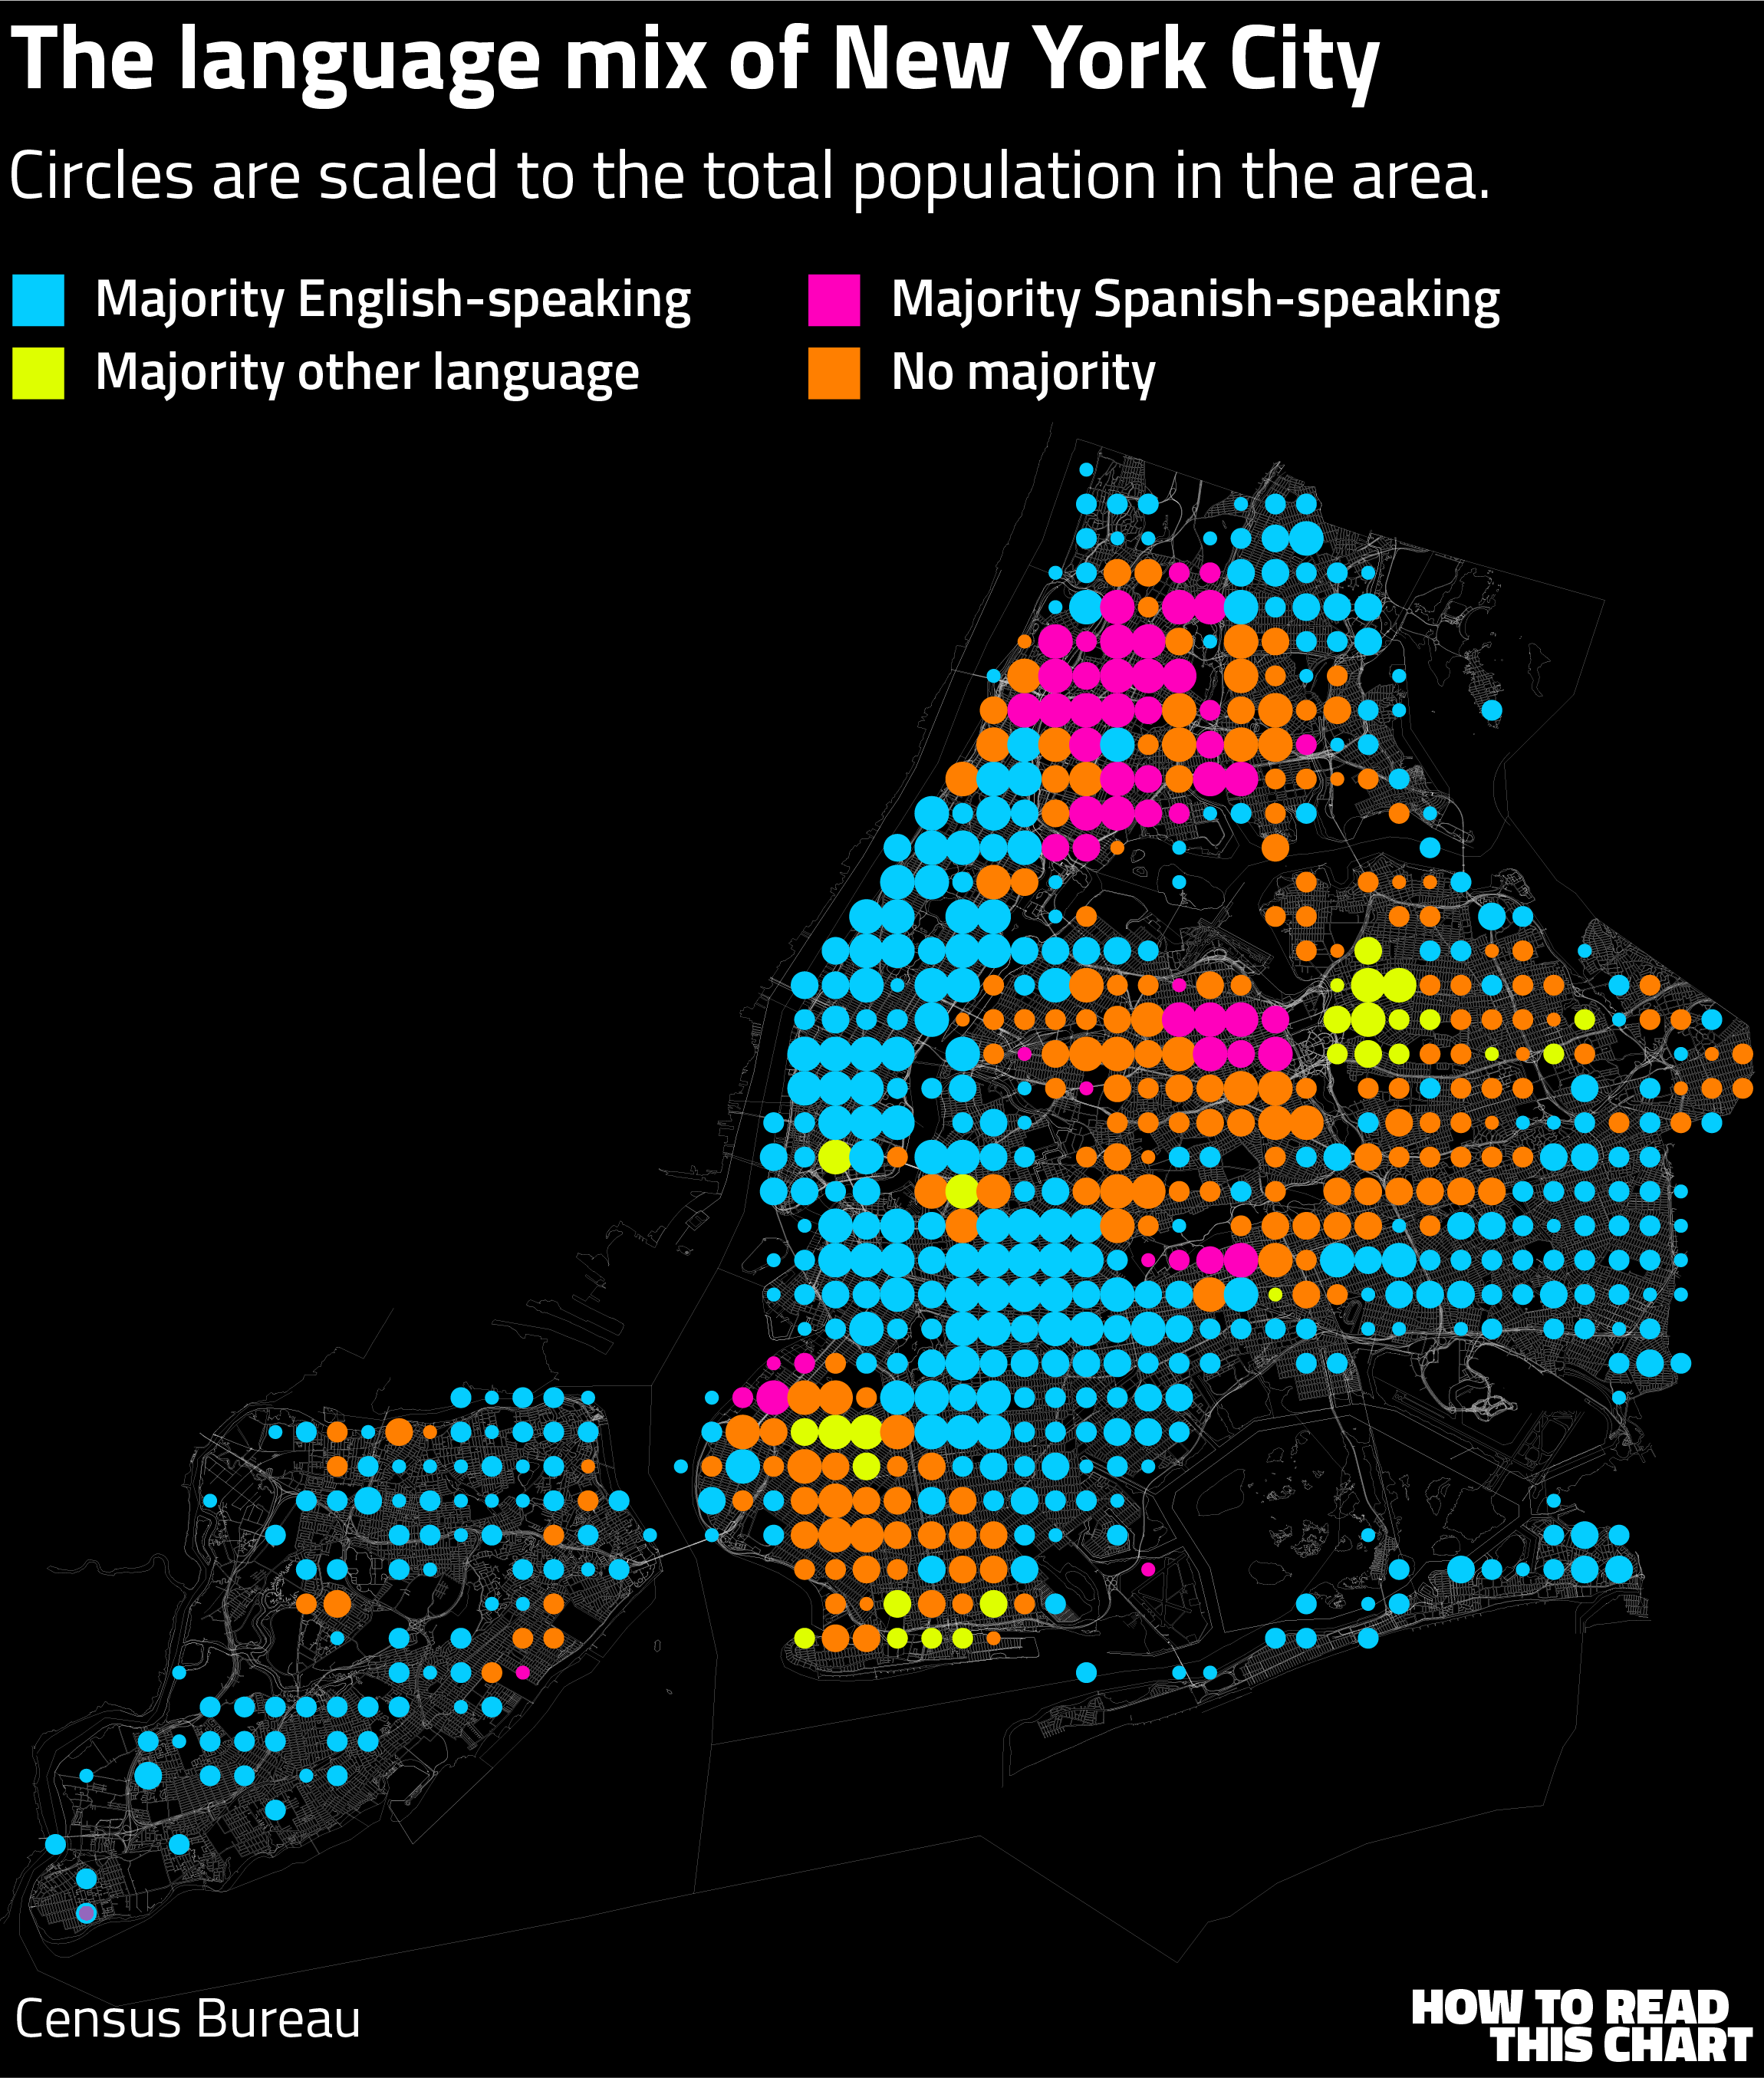
There are notable deviations from Allen's. First, the colors aren't depicting a bivariate scale in the way his does. Second, the dots are assigned by hundredths of a degree latitude and longitude. And, third, the size of each dot is a function of quintiles of population, rather than population density. (In other words, the largest dots are the fifth of dots with the largest population.)
Nonetheless, there's a lot packed into that image. You can see the diversity of Brooklyn (the orange cluster at lower center), the Spanish language prominence in the Bronx (top center) and areas in which other languages are more common (like the heavily Chinese-speaking Flushing neighborhood closer to the right-hand side).
Or, instead of a comparison, we can just look at the propensity of different languages across the city. The Census Bureau data at the granular level uses broad language groupings, but certain neighborhoods and boroughs light up under different conditions.

(The category “non-English” shows anyone who doesn’t primarily speak English at home, meaning it’s an aggregate of the four categories below it.)
I've gotten a bit far away from Allen's original map, but that's what a great visualization does: it inspires imitations and remixes.
In our email exchange, I asked him how he first got into making maps. (For those curious, he uses the programming language Python, the open-source mapping software QGIS and the graphics editing software Inkscape.)
"As a kid," he told me, he "always loved looking at maps." He "used to make maps of fictional cities for fun," as included in a National Geographic profile a few years ago.
We arrive back at my original point. The open web, with people sharing their creations and piggy-backing on one another, breeds creativity and inspiration. Some kid may see Allen's map of Montreal and want to make his own imaginary version, to dream up what languages might be spoken, where and why.
Chapter 2
Knowing your own senator is maturity. Knowing all of them is deviancy.
Let us diverge now from the high-mindedness of that first section, spiraling downward from lofty inspirational heights to more mundane terrain.
The Cooperative Election Study is a national research project that polls Americans at the time of each federal election. It includes a set of questions that I've always found interesting: Can Americans identify their elected leaders?
In fairness, it's a little easier than that. People are asked if they recognize the name of their elected officials and, if so, whether they can identify the person's party. So if you are a New Yorker, you'd be asked (for example) if you'd every heard of Charles Schumer and, if so, what party he's a member of.
Perhaps unsurprisingly, Americans are best at identifying their governors. What is a governor but a cute little simulacrum of a president, after all, and everyone knows the president!
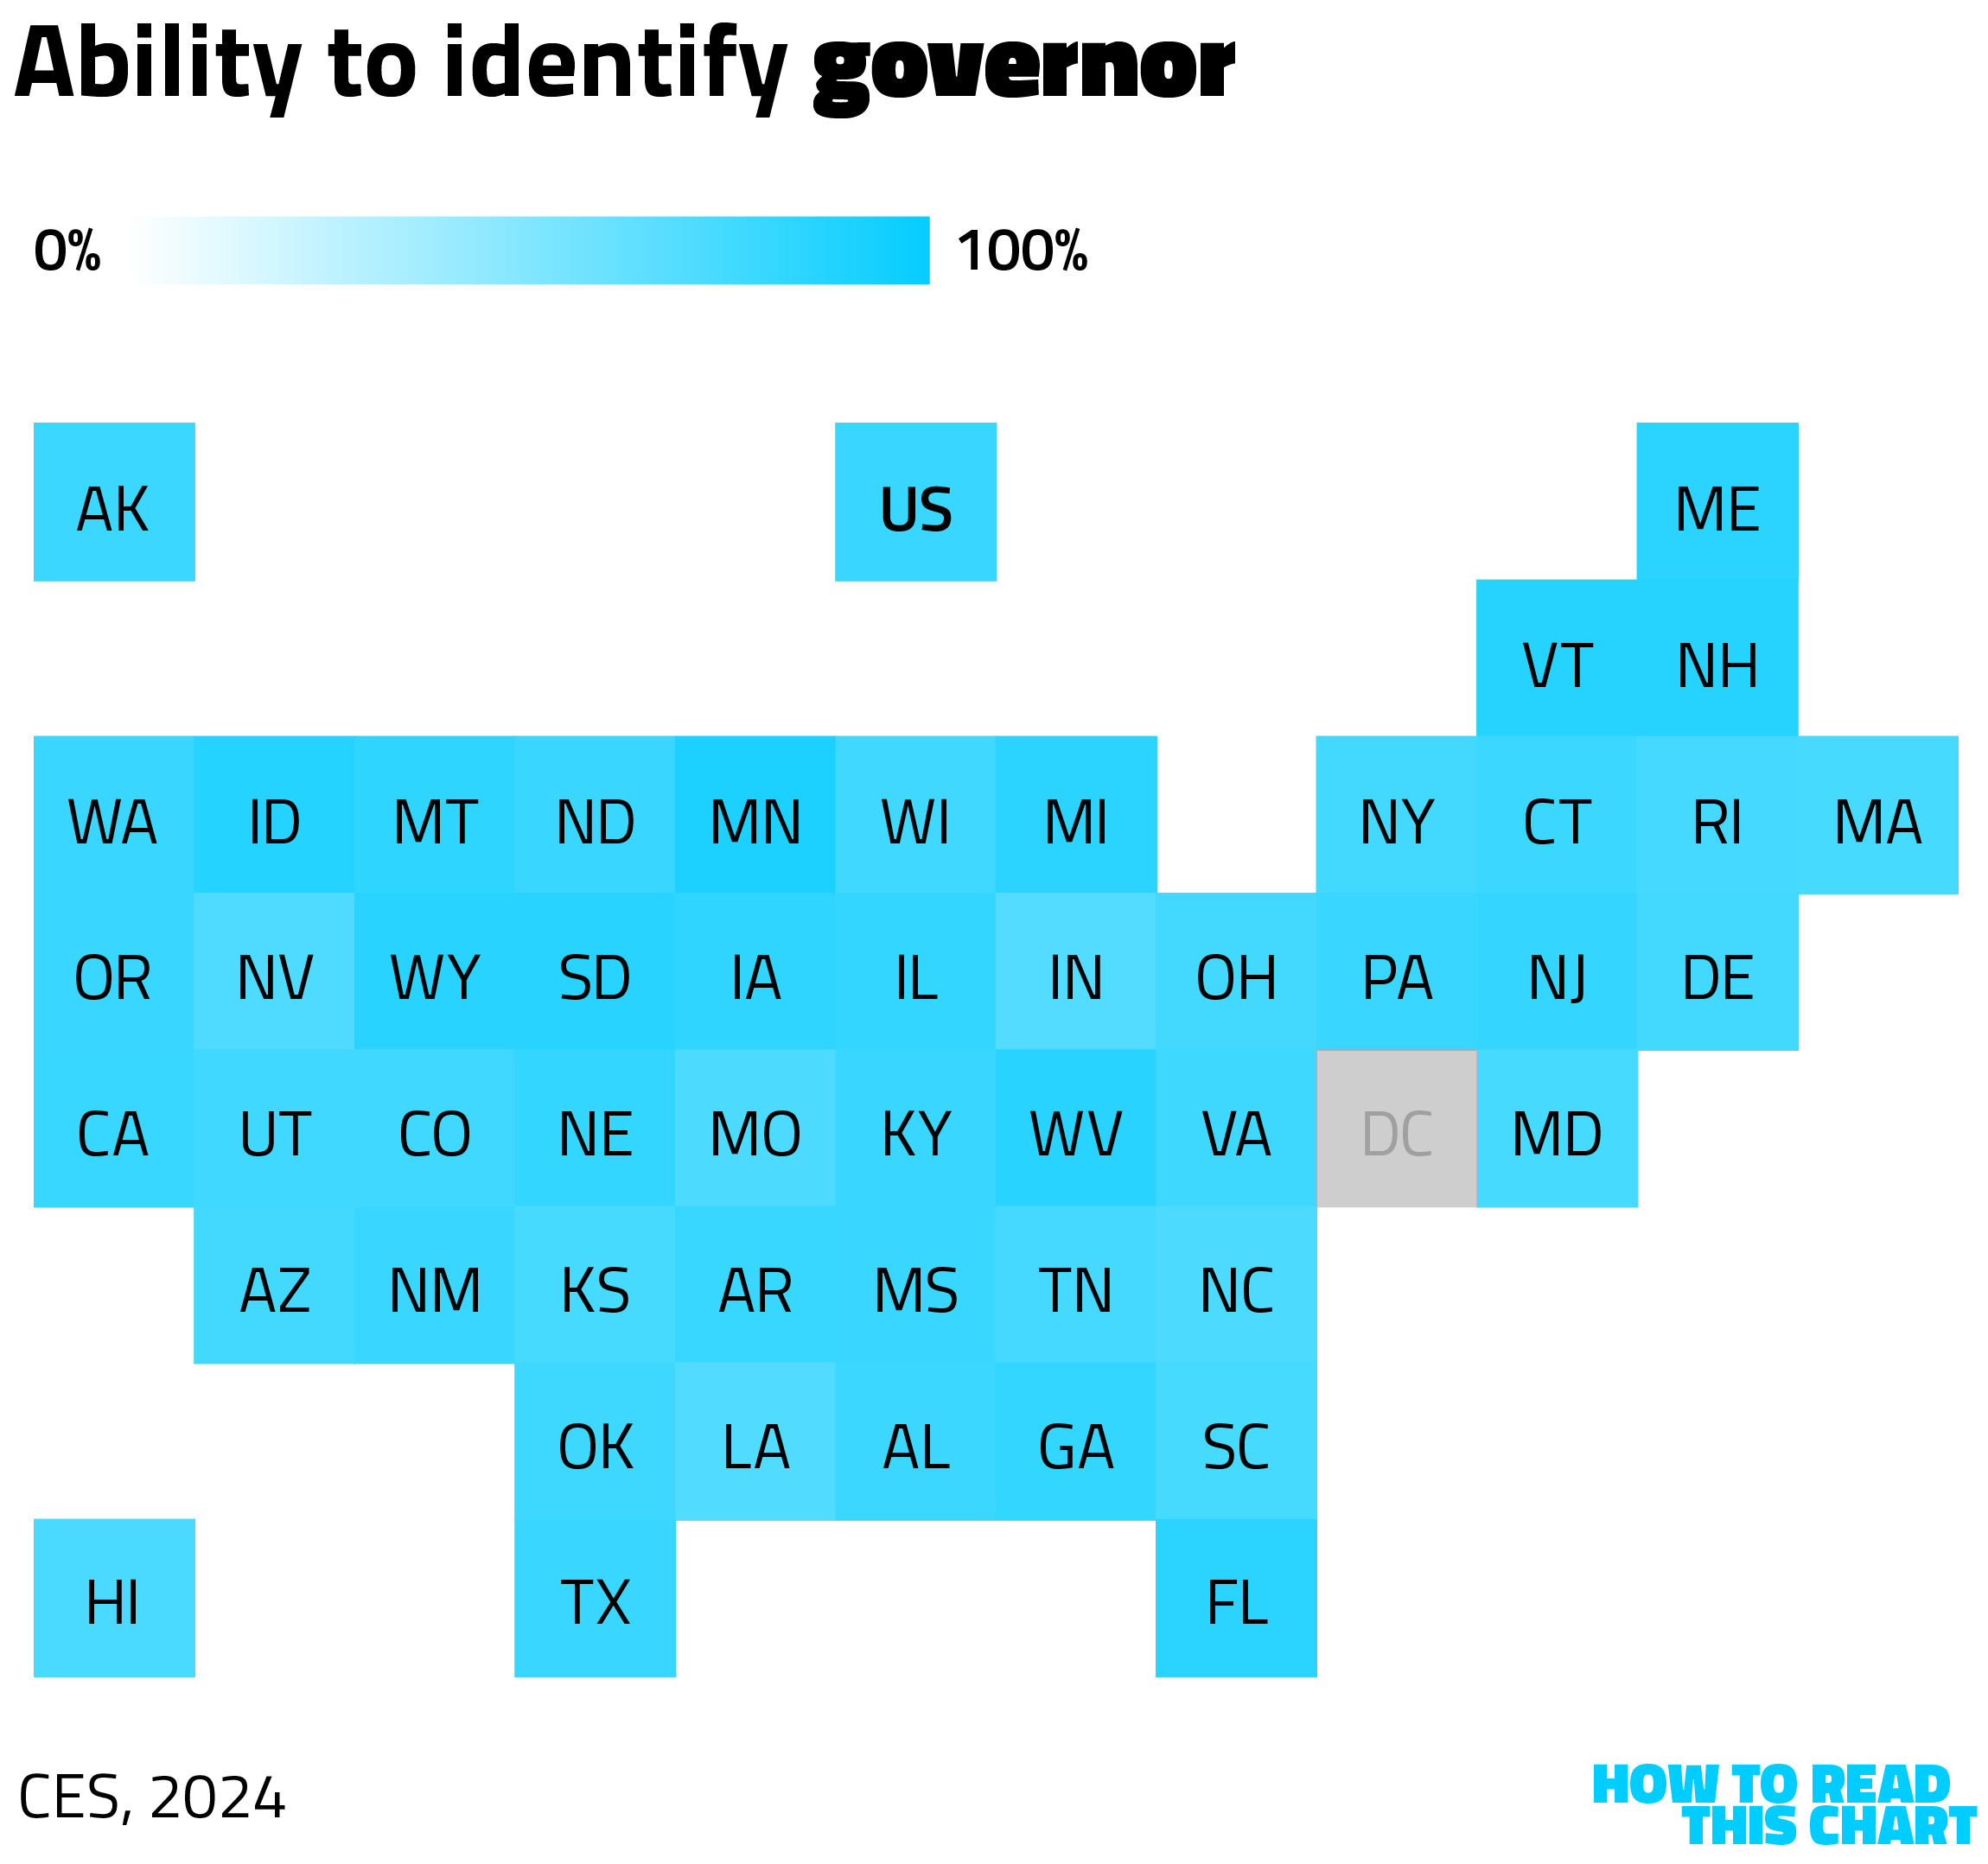
The state where residents were most adept at naming their governor was Minnesota — not surprising since at the time of the 2024 CES he was also running for vice president.
Respondents also did pretty well on U.S. representatives. These people run every two years, after all, and often get reelected over and over again.
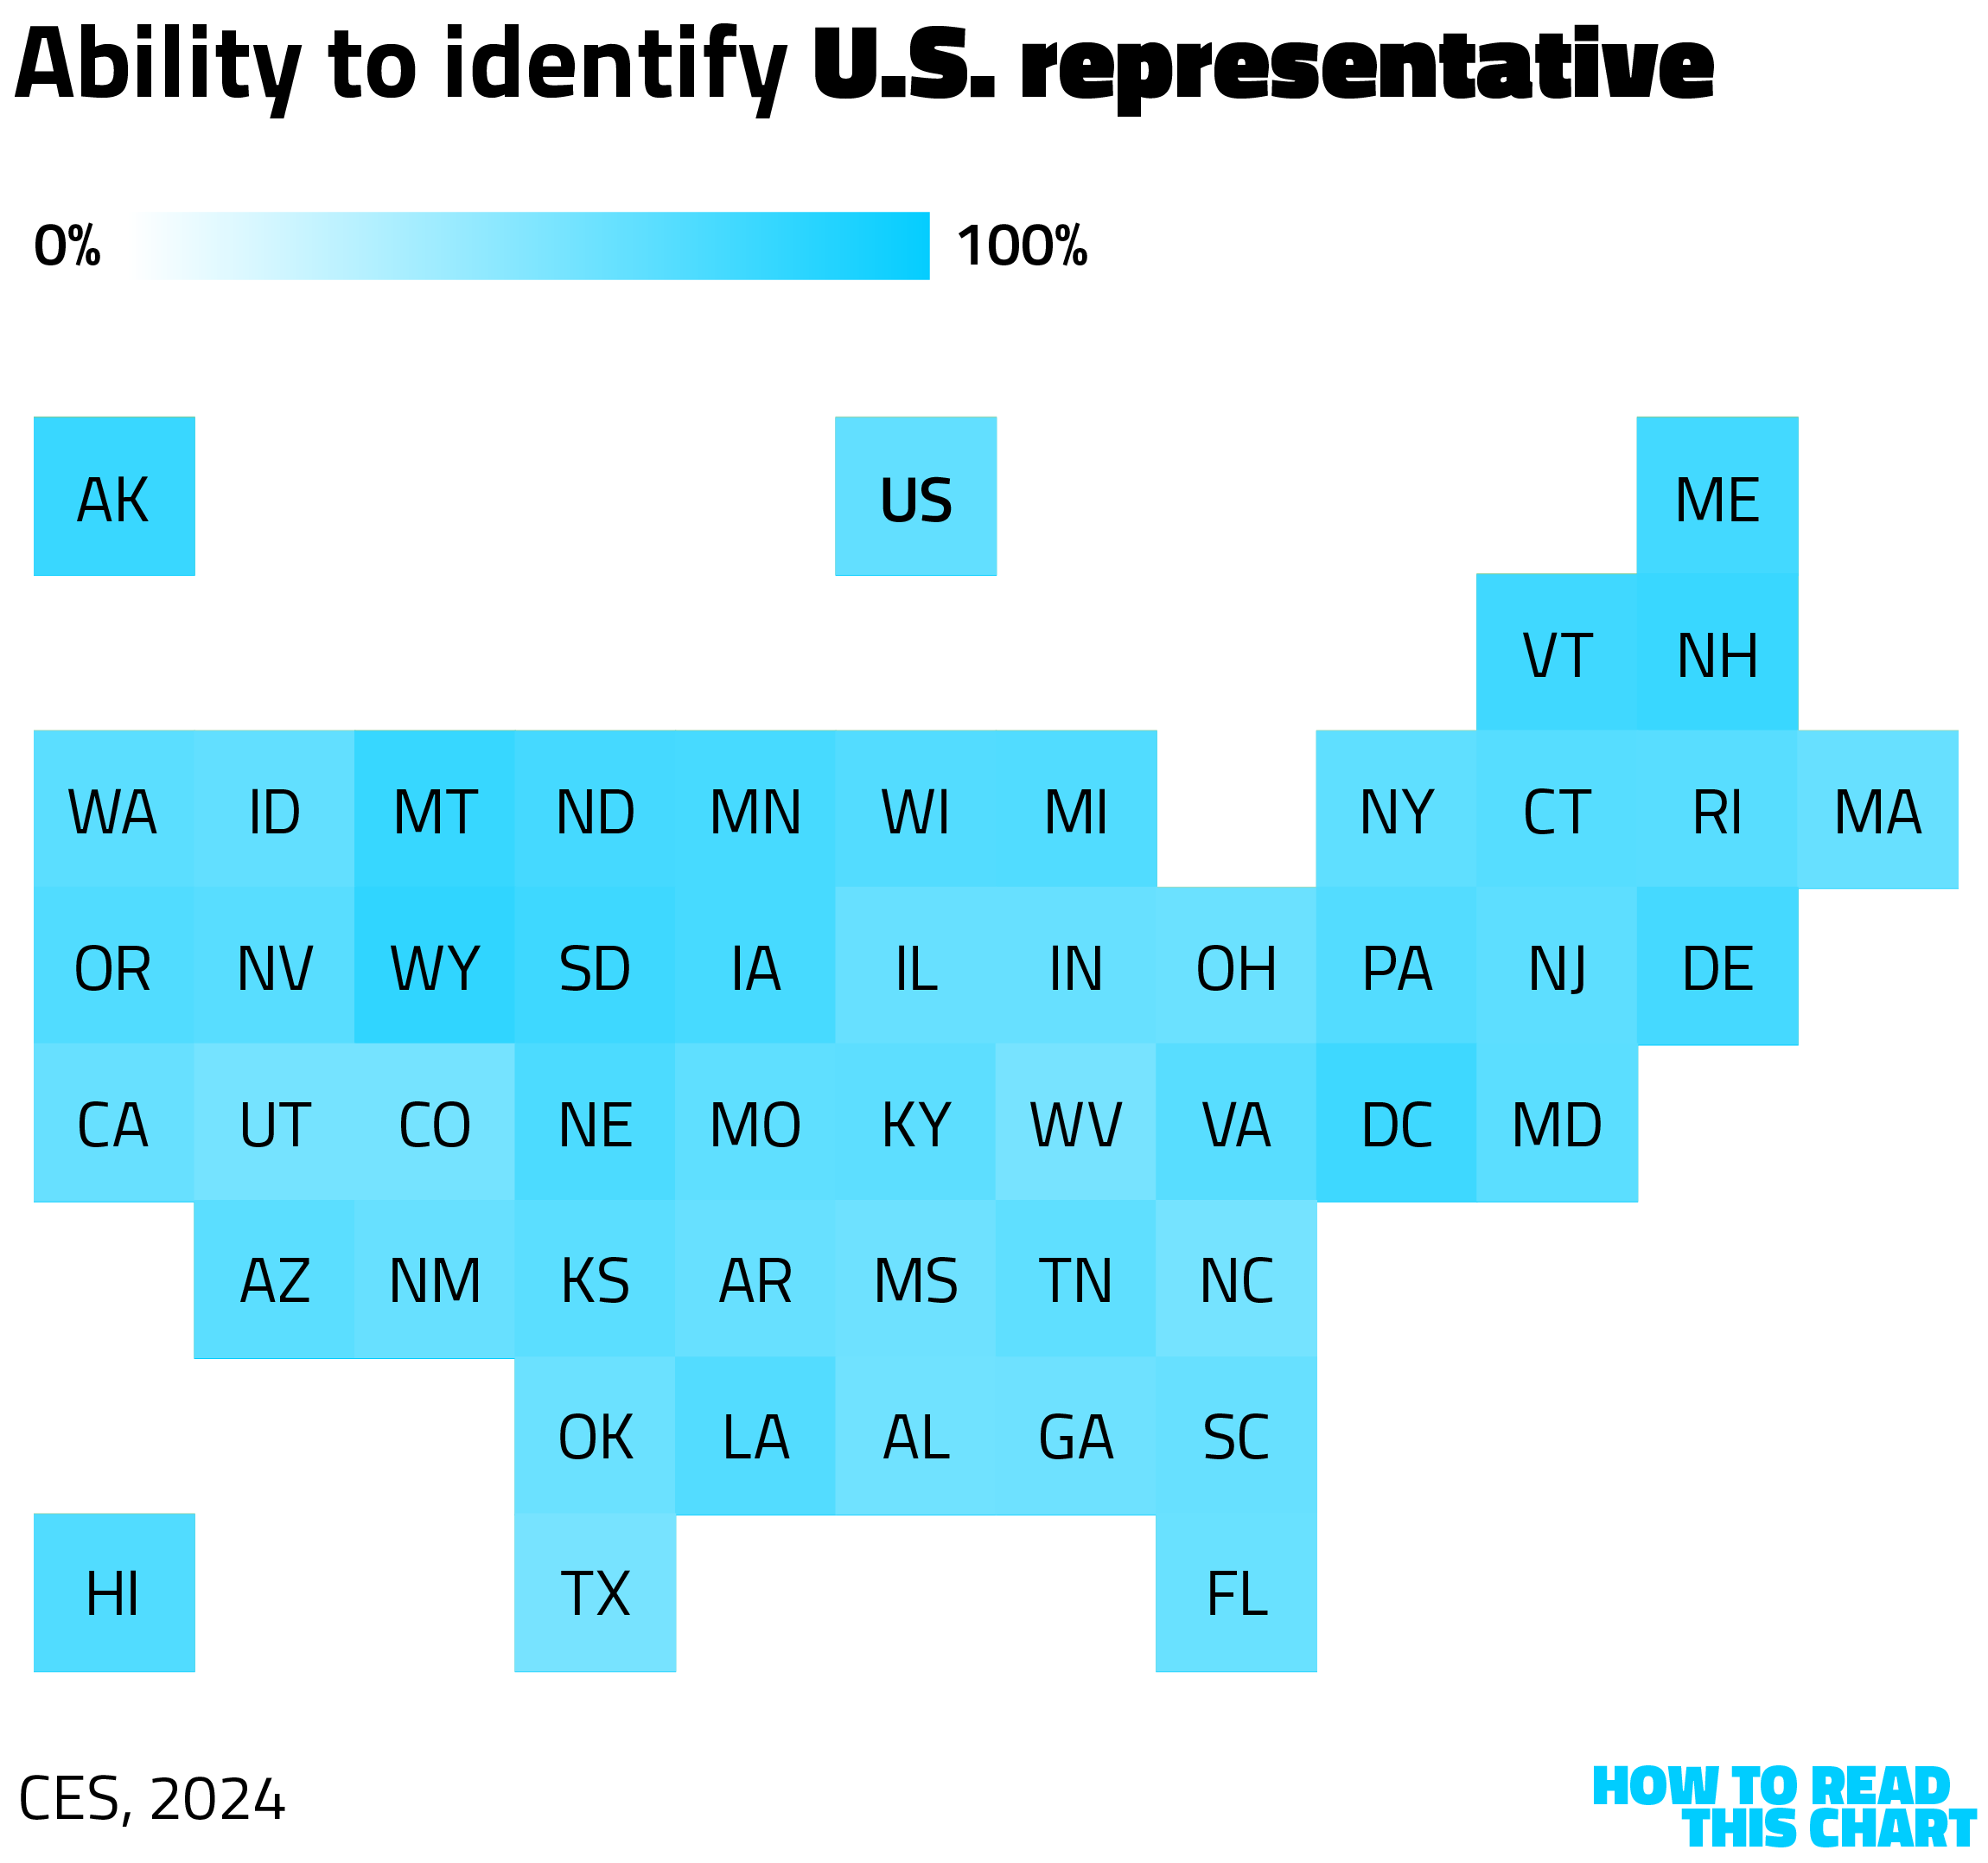
The state with the highest level of recognition — Wyoming — has another advantage: only one representative. The lowest level of recognition was in Texas.
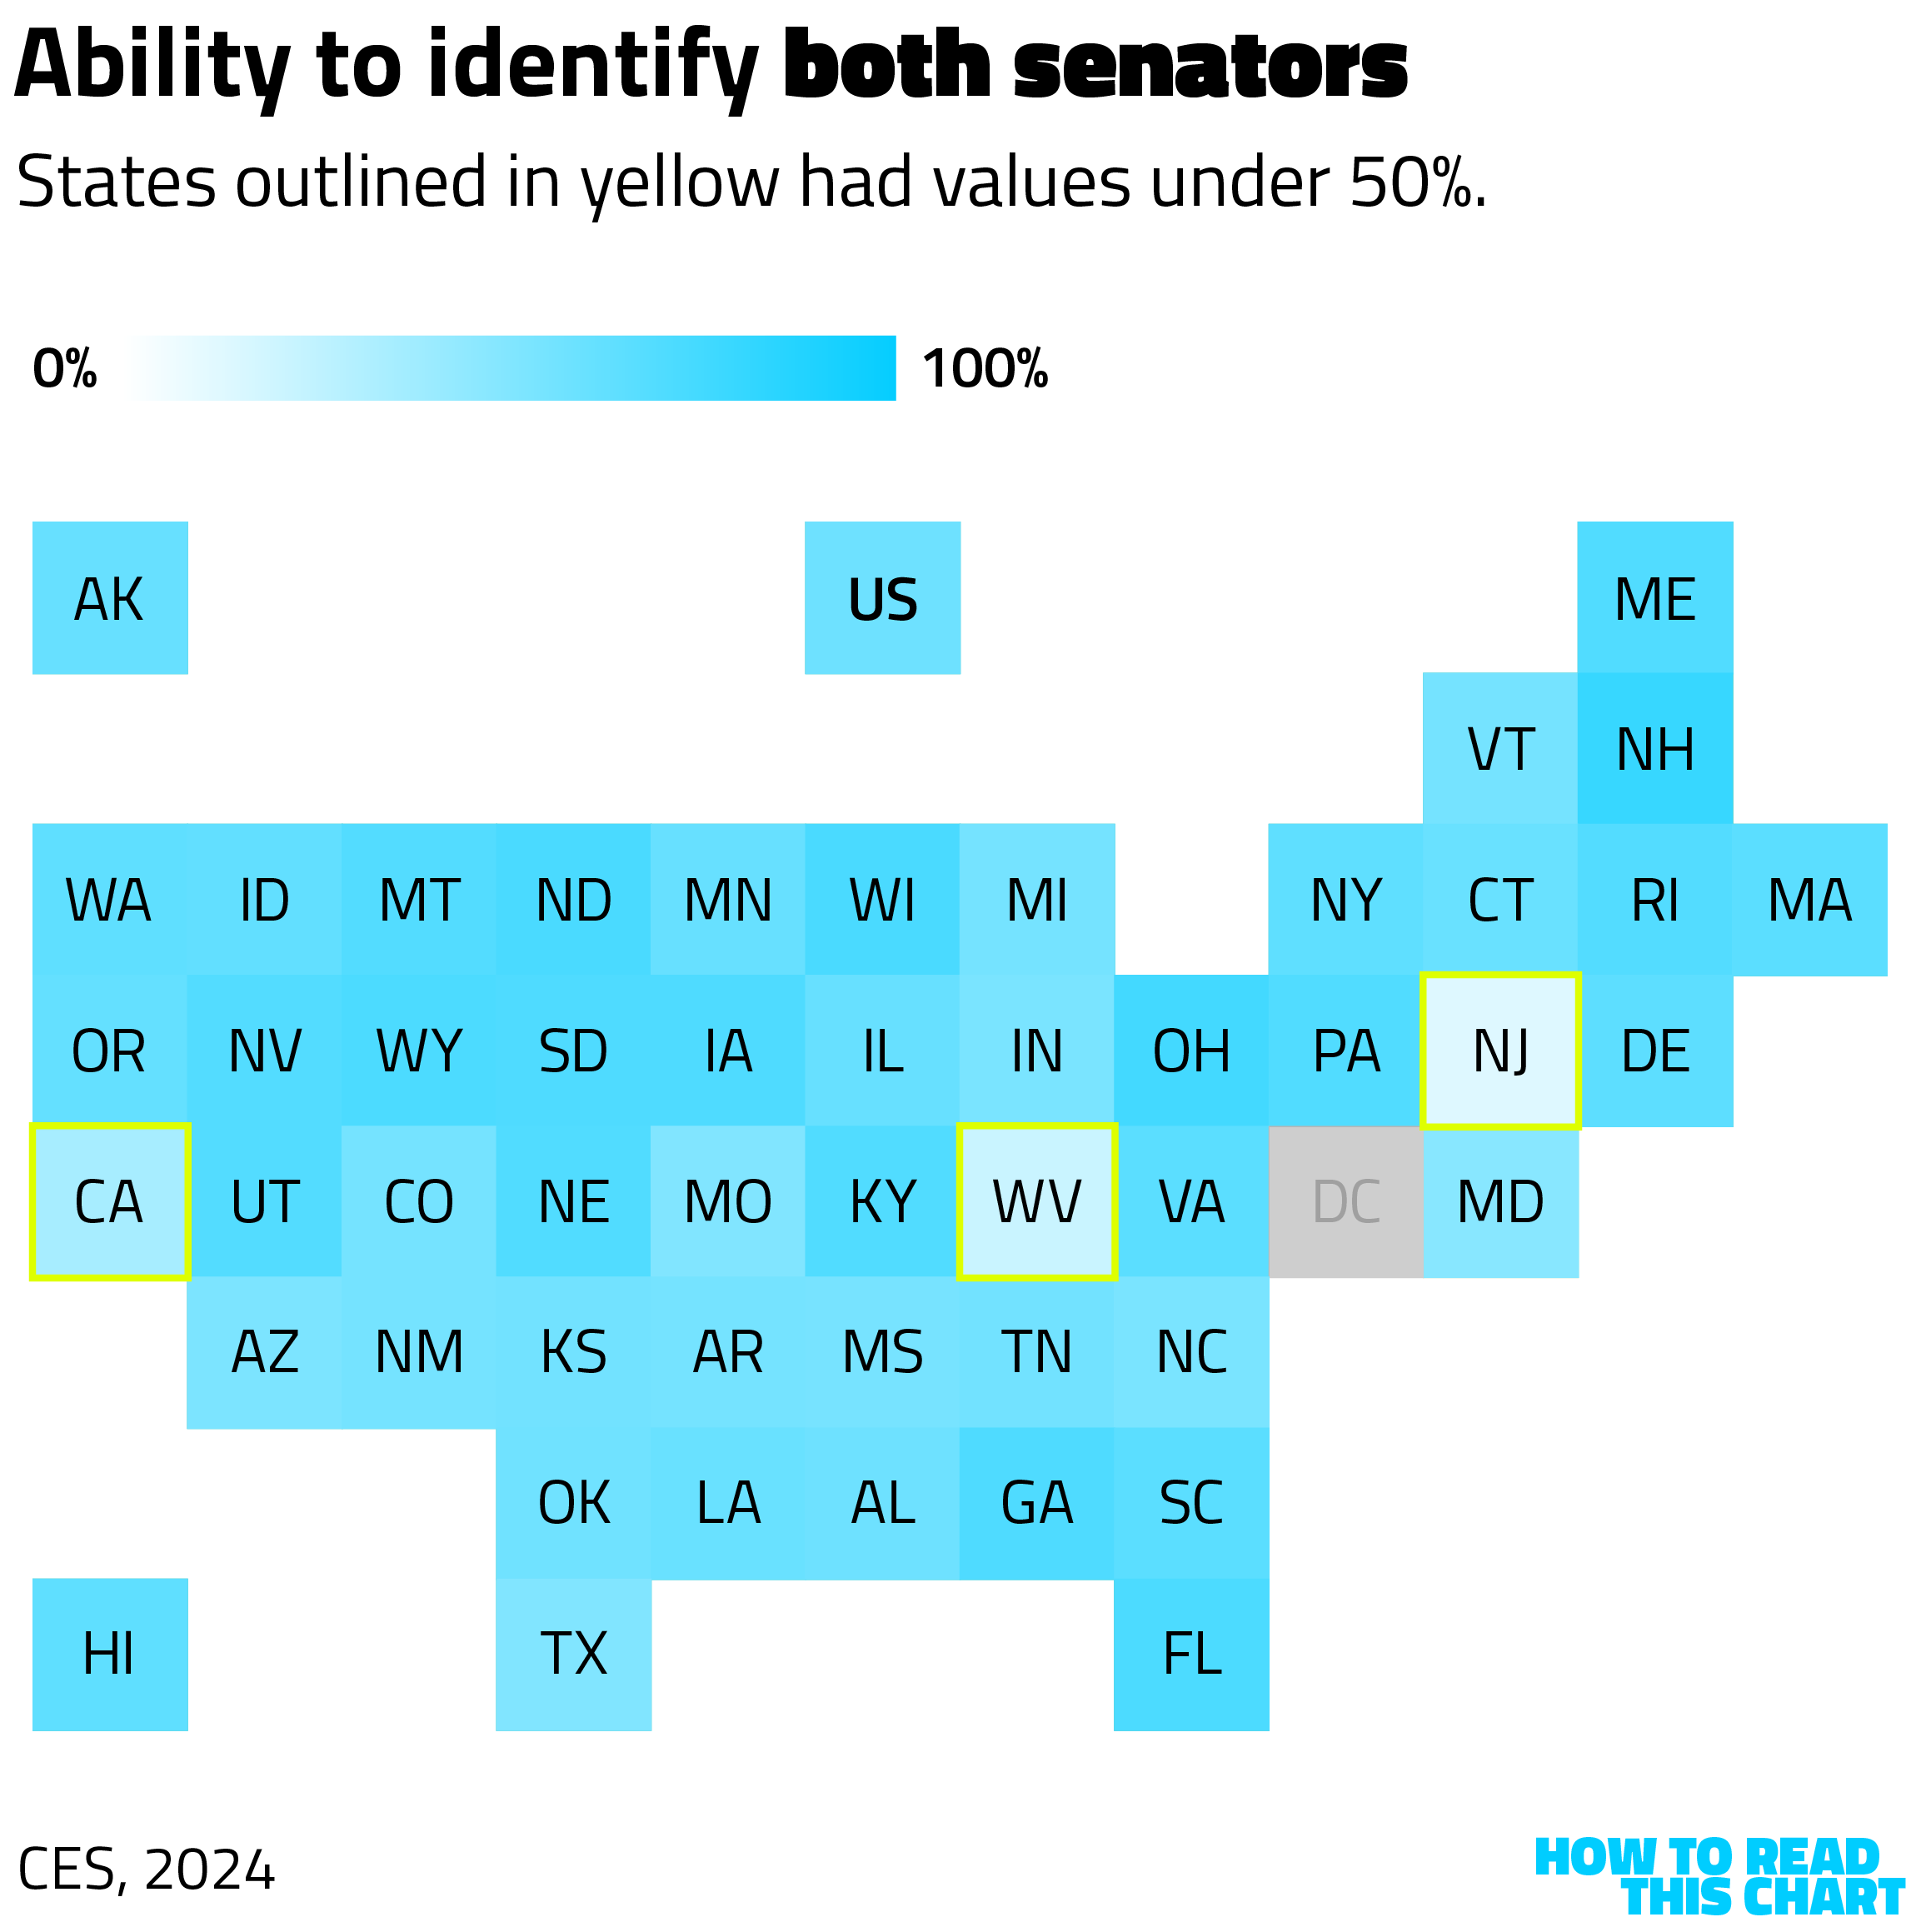
Senators, however, posed more of a challenge. Residents of some states had an excuse. Dianne Feinstein's death in 2023 meant that California was represented by an appointee, Laphonza Butler, who lacked significant name ID.
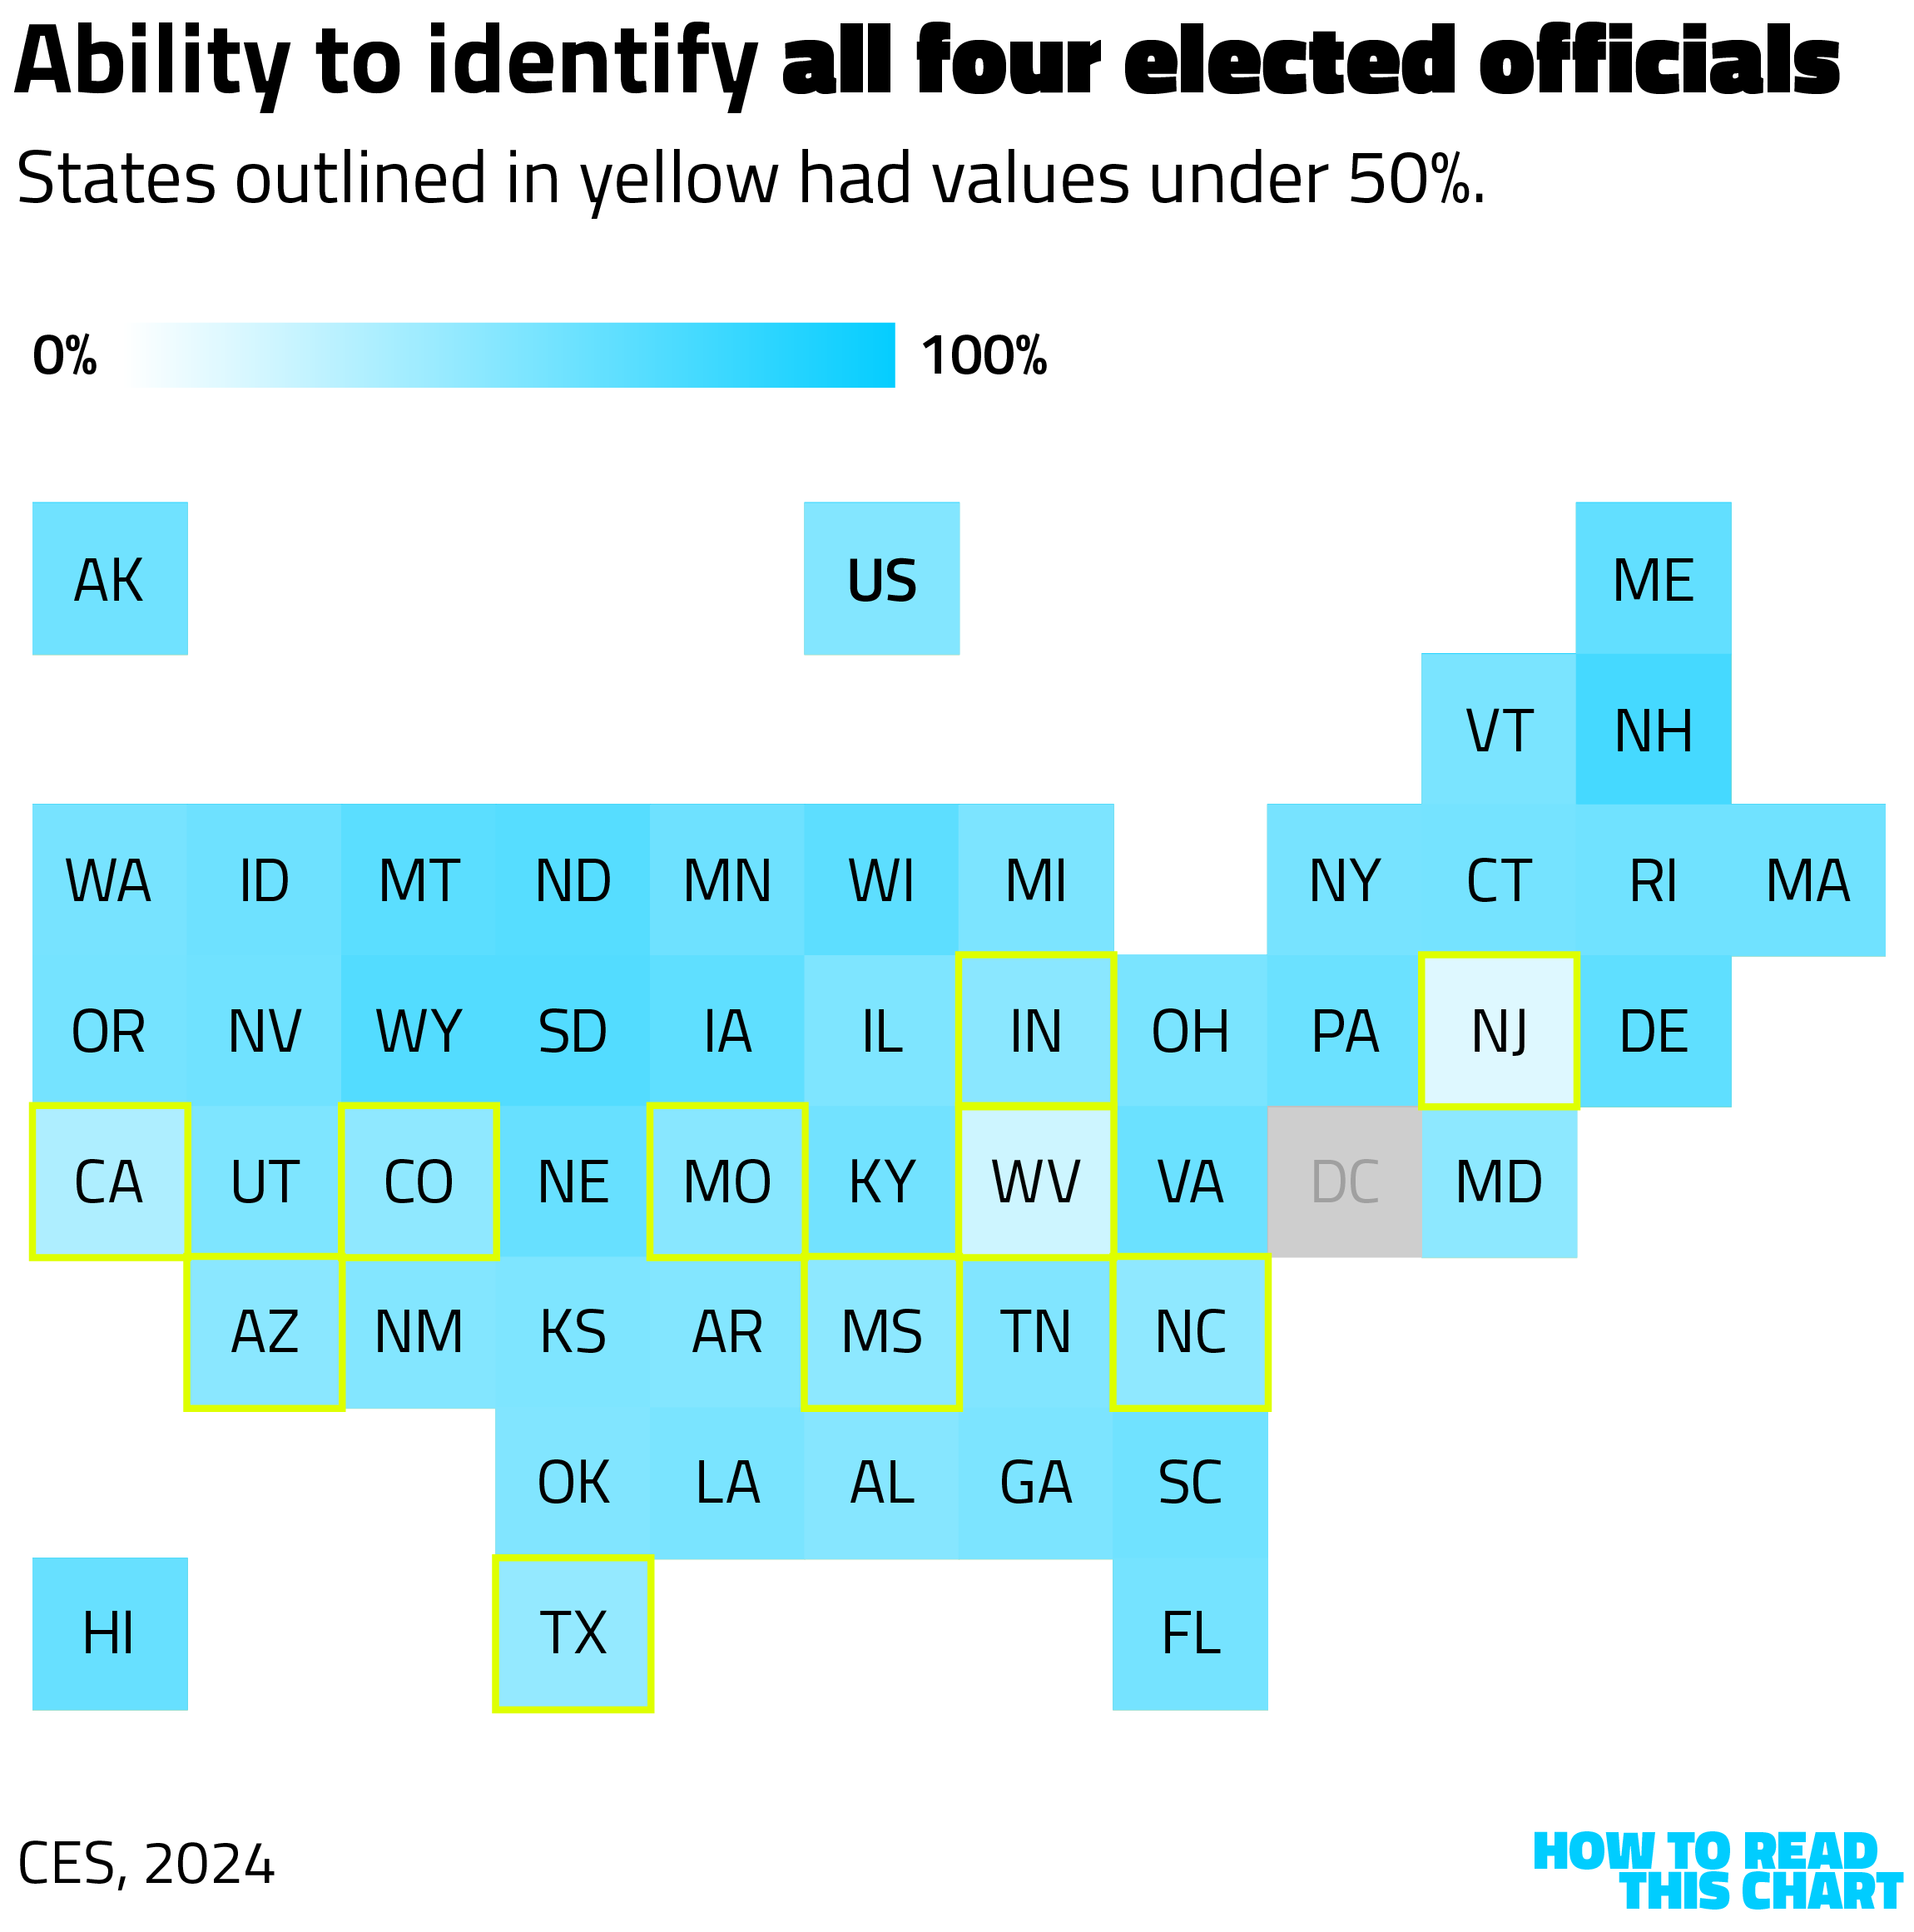
Only about half of Americans could name all four elected officials. In ten states, fewer than half could.
Unsurprisingly, there were big differences in familiarity by age and by party. Democrats and Republicans were each more likely to know their elected leaders than were independents — in part because partisans are more likely to vote in primaries but in part because they are more likely to pay attention to politics.
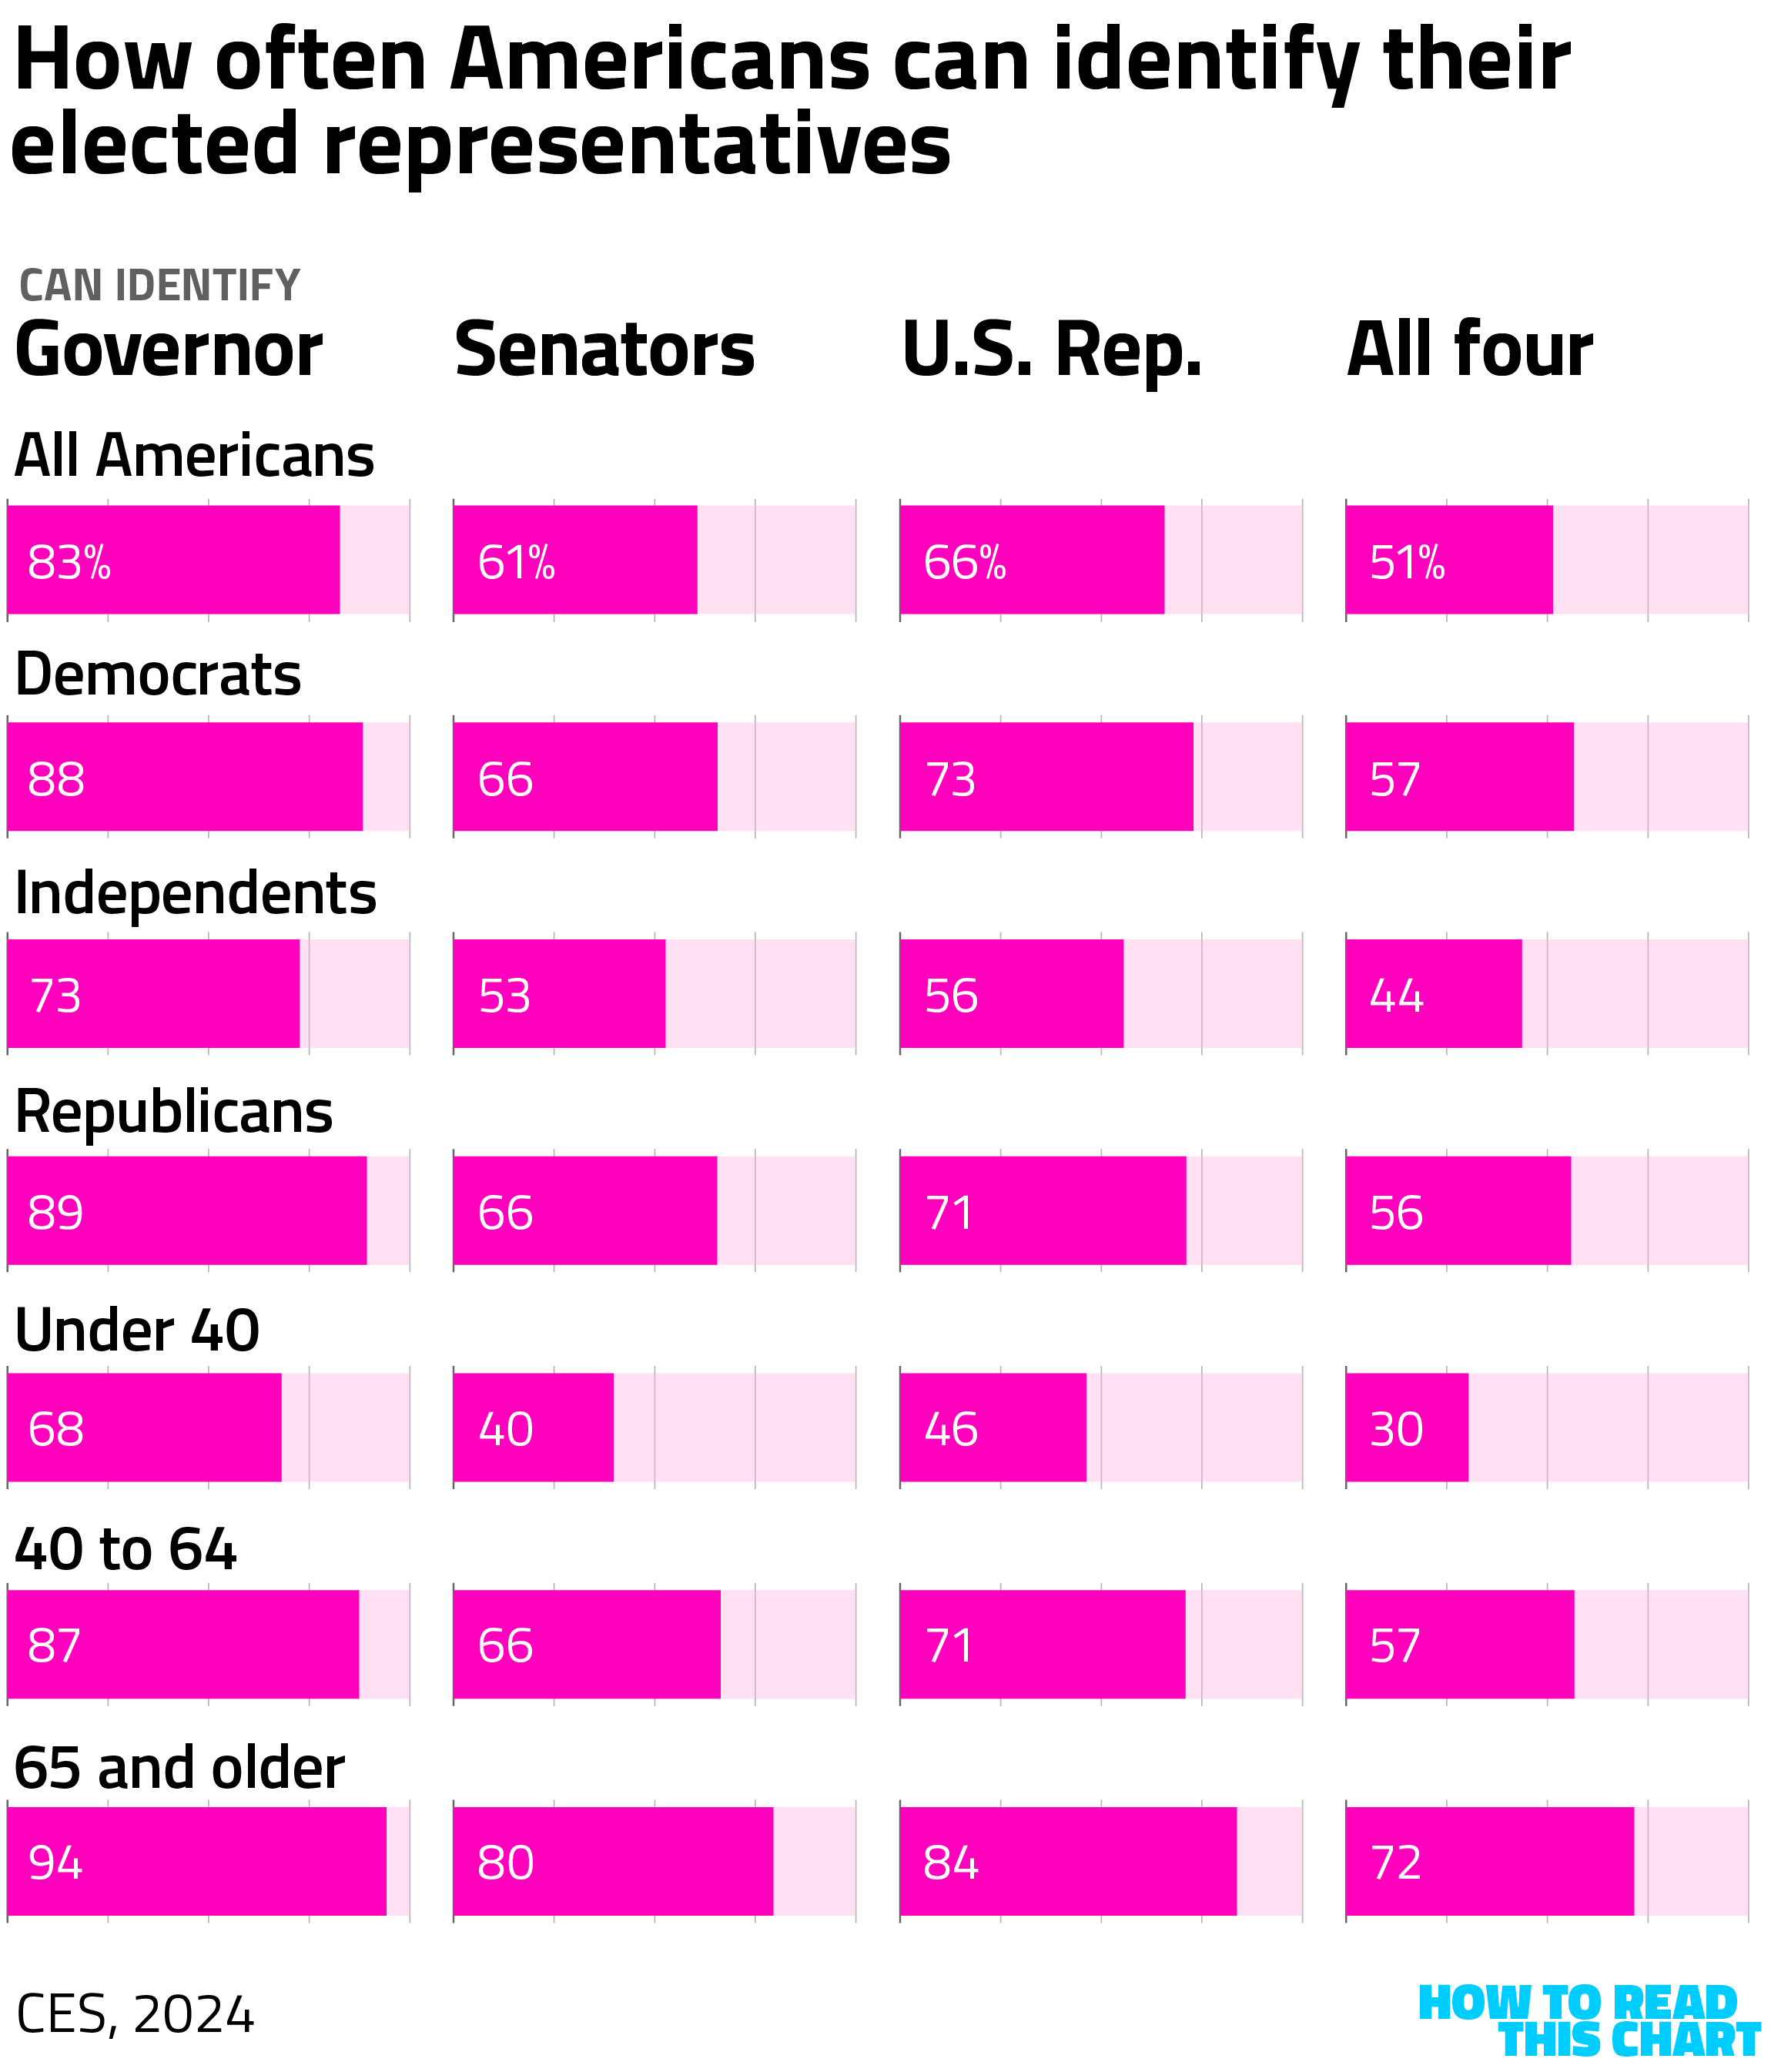
Independents also tend to be younger. And older Americans were much more likely than younger to know their federal representatives and their governor. Only about 3 in 10 adults under the age of 40 recognized the names of all four.
The state whose residents were most likely to recognize all four elected officials? New Hampshire, also the second-oldest state in America.
Chapter 3
The deaths of ICE detainees
Now we sink further still, from mundanity to tragedy.
Syracuse University's Austin Kocher is an invaluable resource for information and analysis about immigration in the United States. He recently produced a map showing where the exceptional number of deaths befalling ICE detainees had occurred.
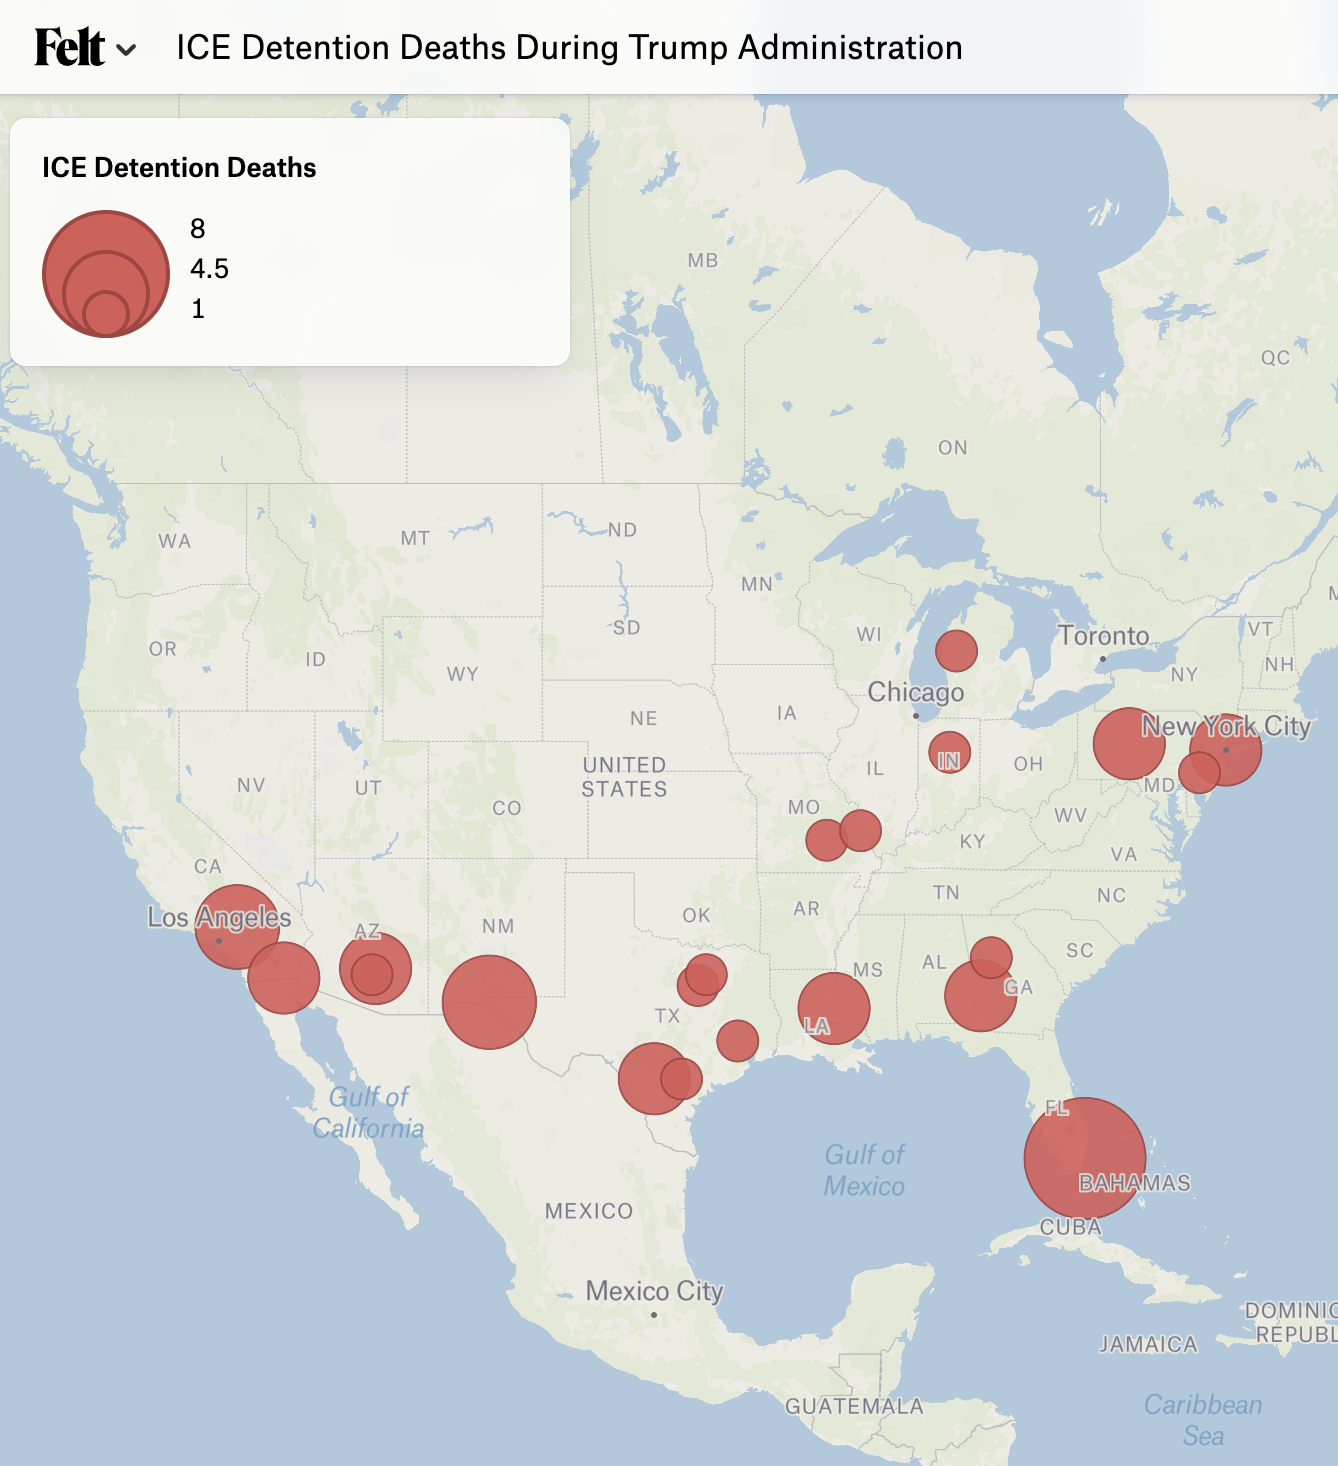
He notes some caveats: the data comes from the Department of Homeland Security itself and may be incomplete or inaccurate; the locations of detainee deaths is identified as the facility where they were known to have been detained, not a facility (like a hospital) where they may have died.
Seeing Kocher's map, I was curious about the other side of these people's life story. Where had they come from? What was the path that brought them from their home countries to their unhappy fates?
Using Kocher's data, I created a map showing the nations of origin and places of death of each detainee he included. What's striking about it is that it is truly global; those who died weren't all immigrants from Mexico and Central America as so many immigrants are.
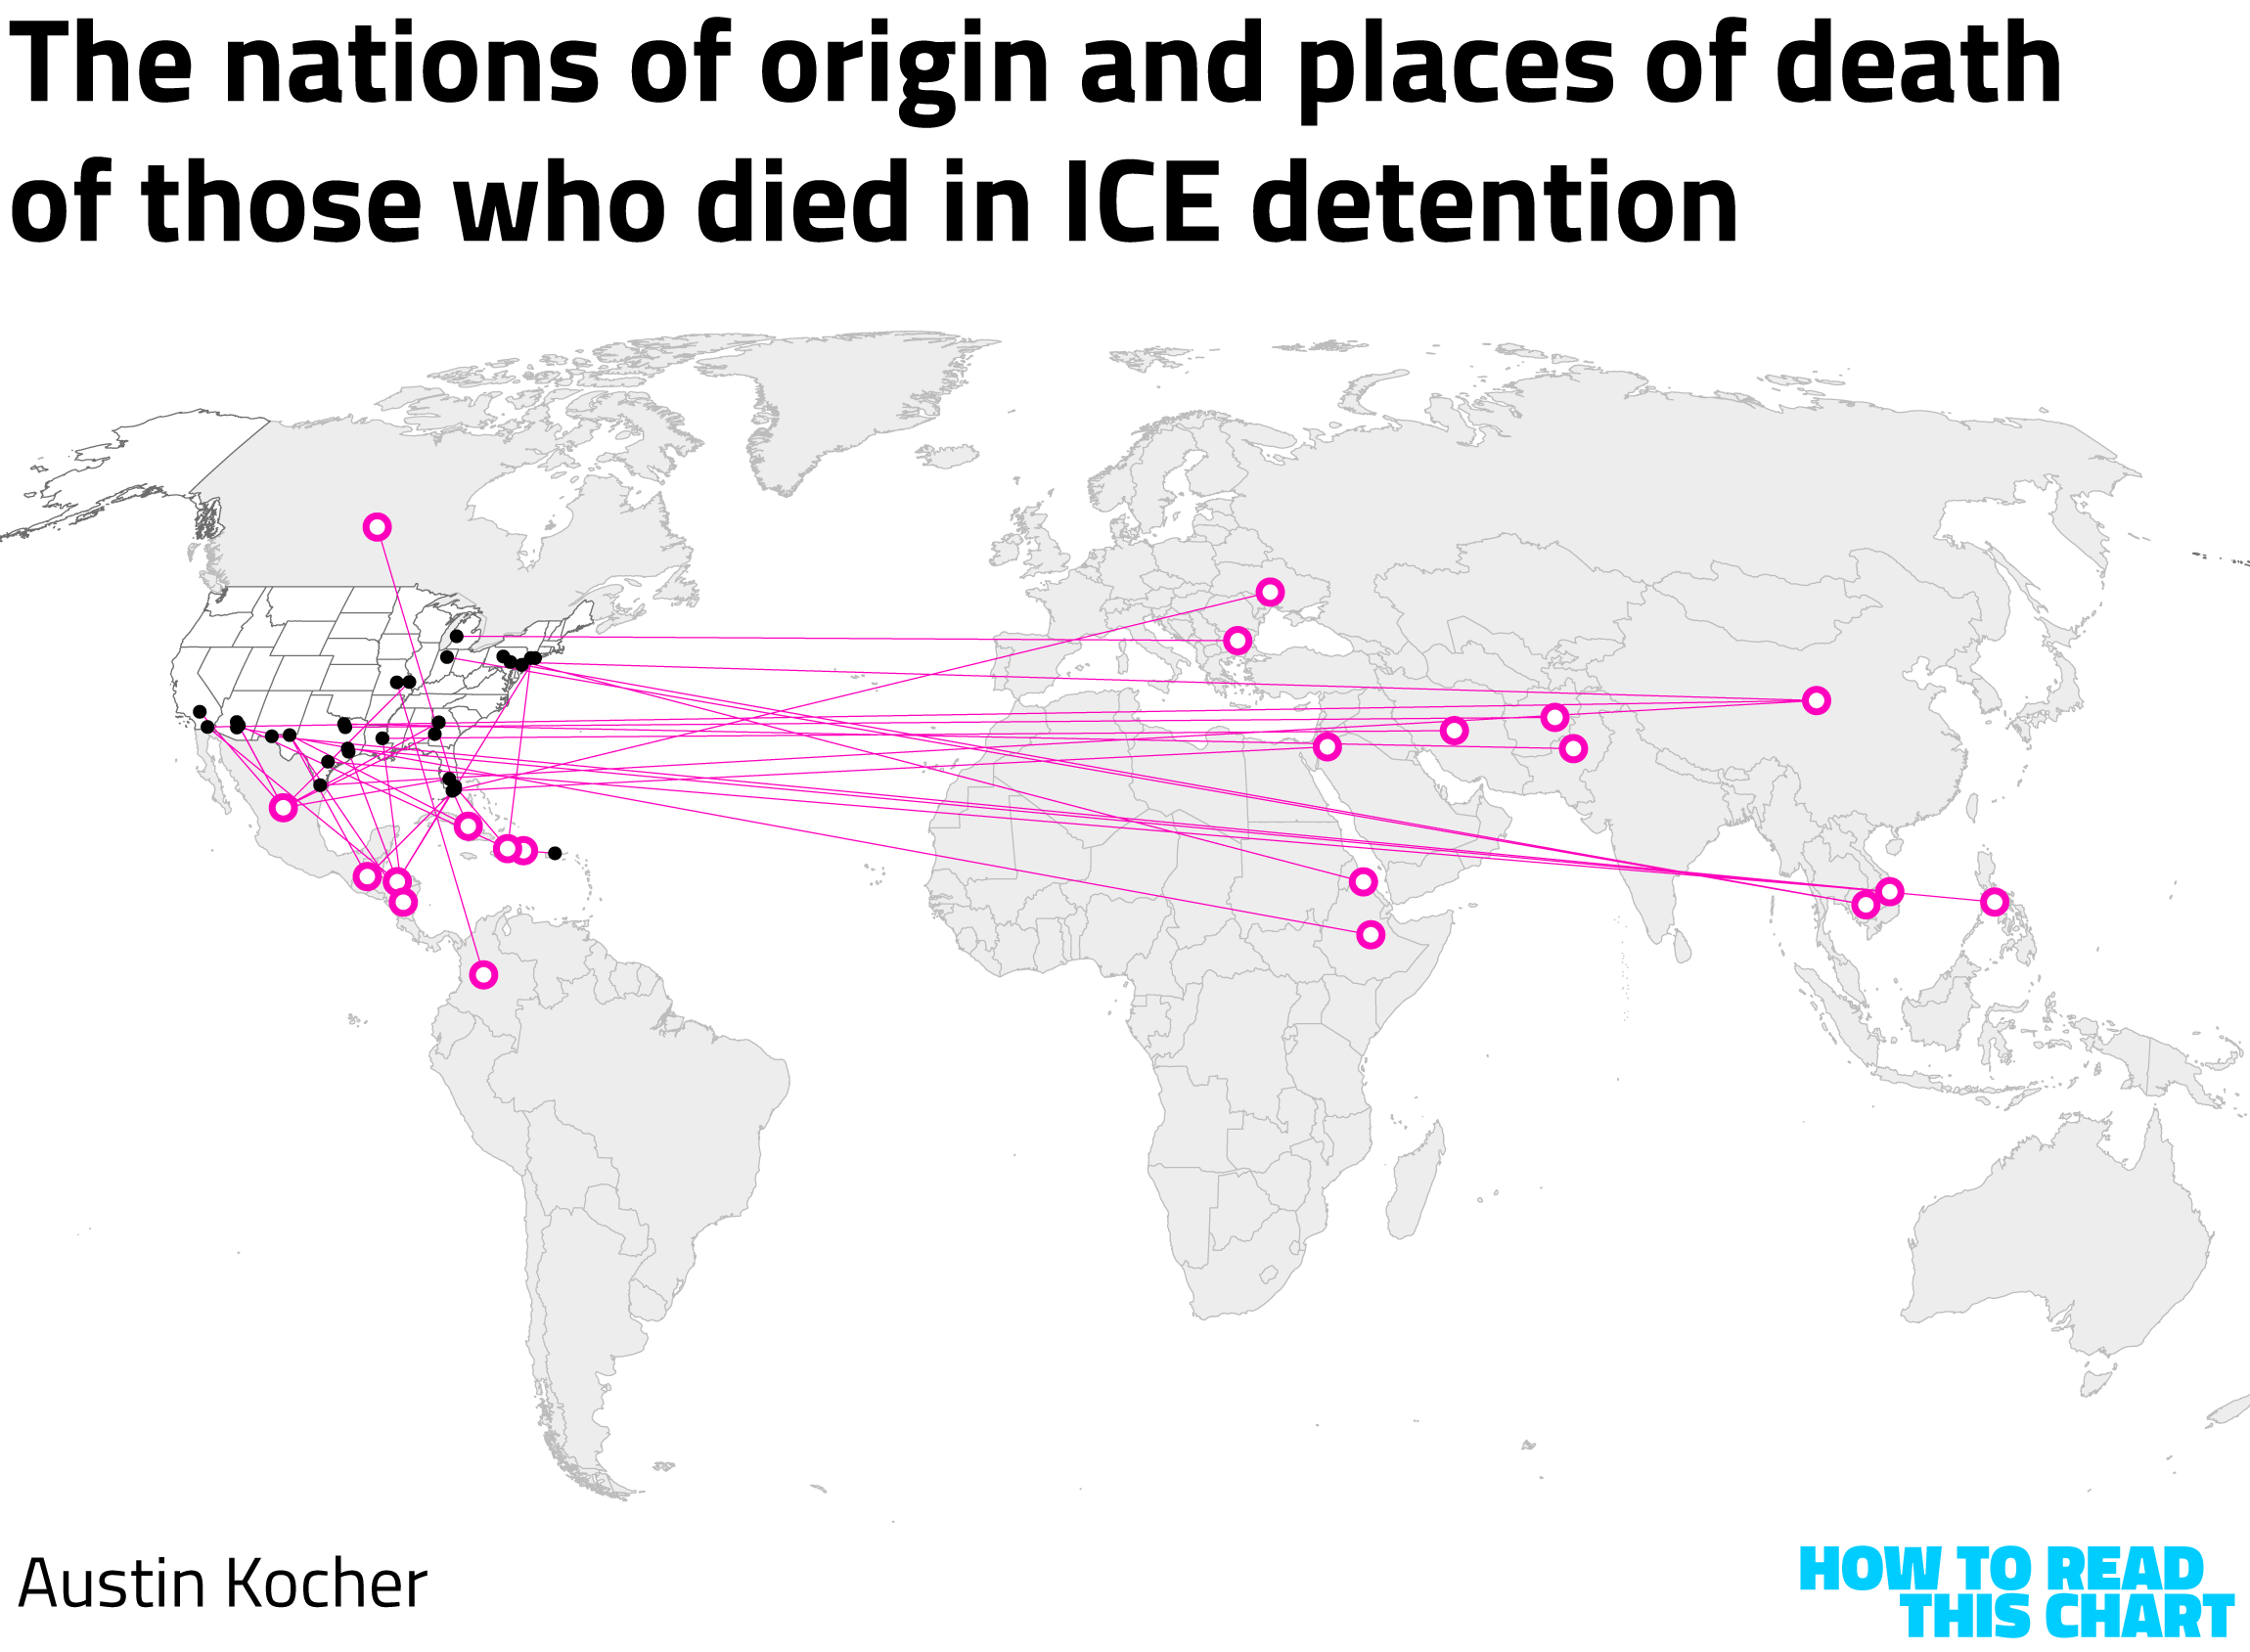
My map is admittedly busy. So I created an animated version, building up the data more slowly to make it easier to pick out the beginning and ending locations.
I don't have much more to say than that. It speaks for itself.
Chapter 4
Now, something less depressing
Hey, look! Did you know that only 13 states are fully north of Mexico and fully south of Canada? Well, it's true.

Some states are close, like Ohio. But every other state (including, obviously, Alaska and Hawaii) has at least part of one county that is higher or lower than our lower and higher neighbors.
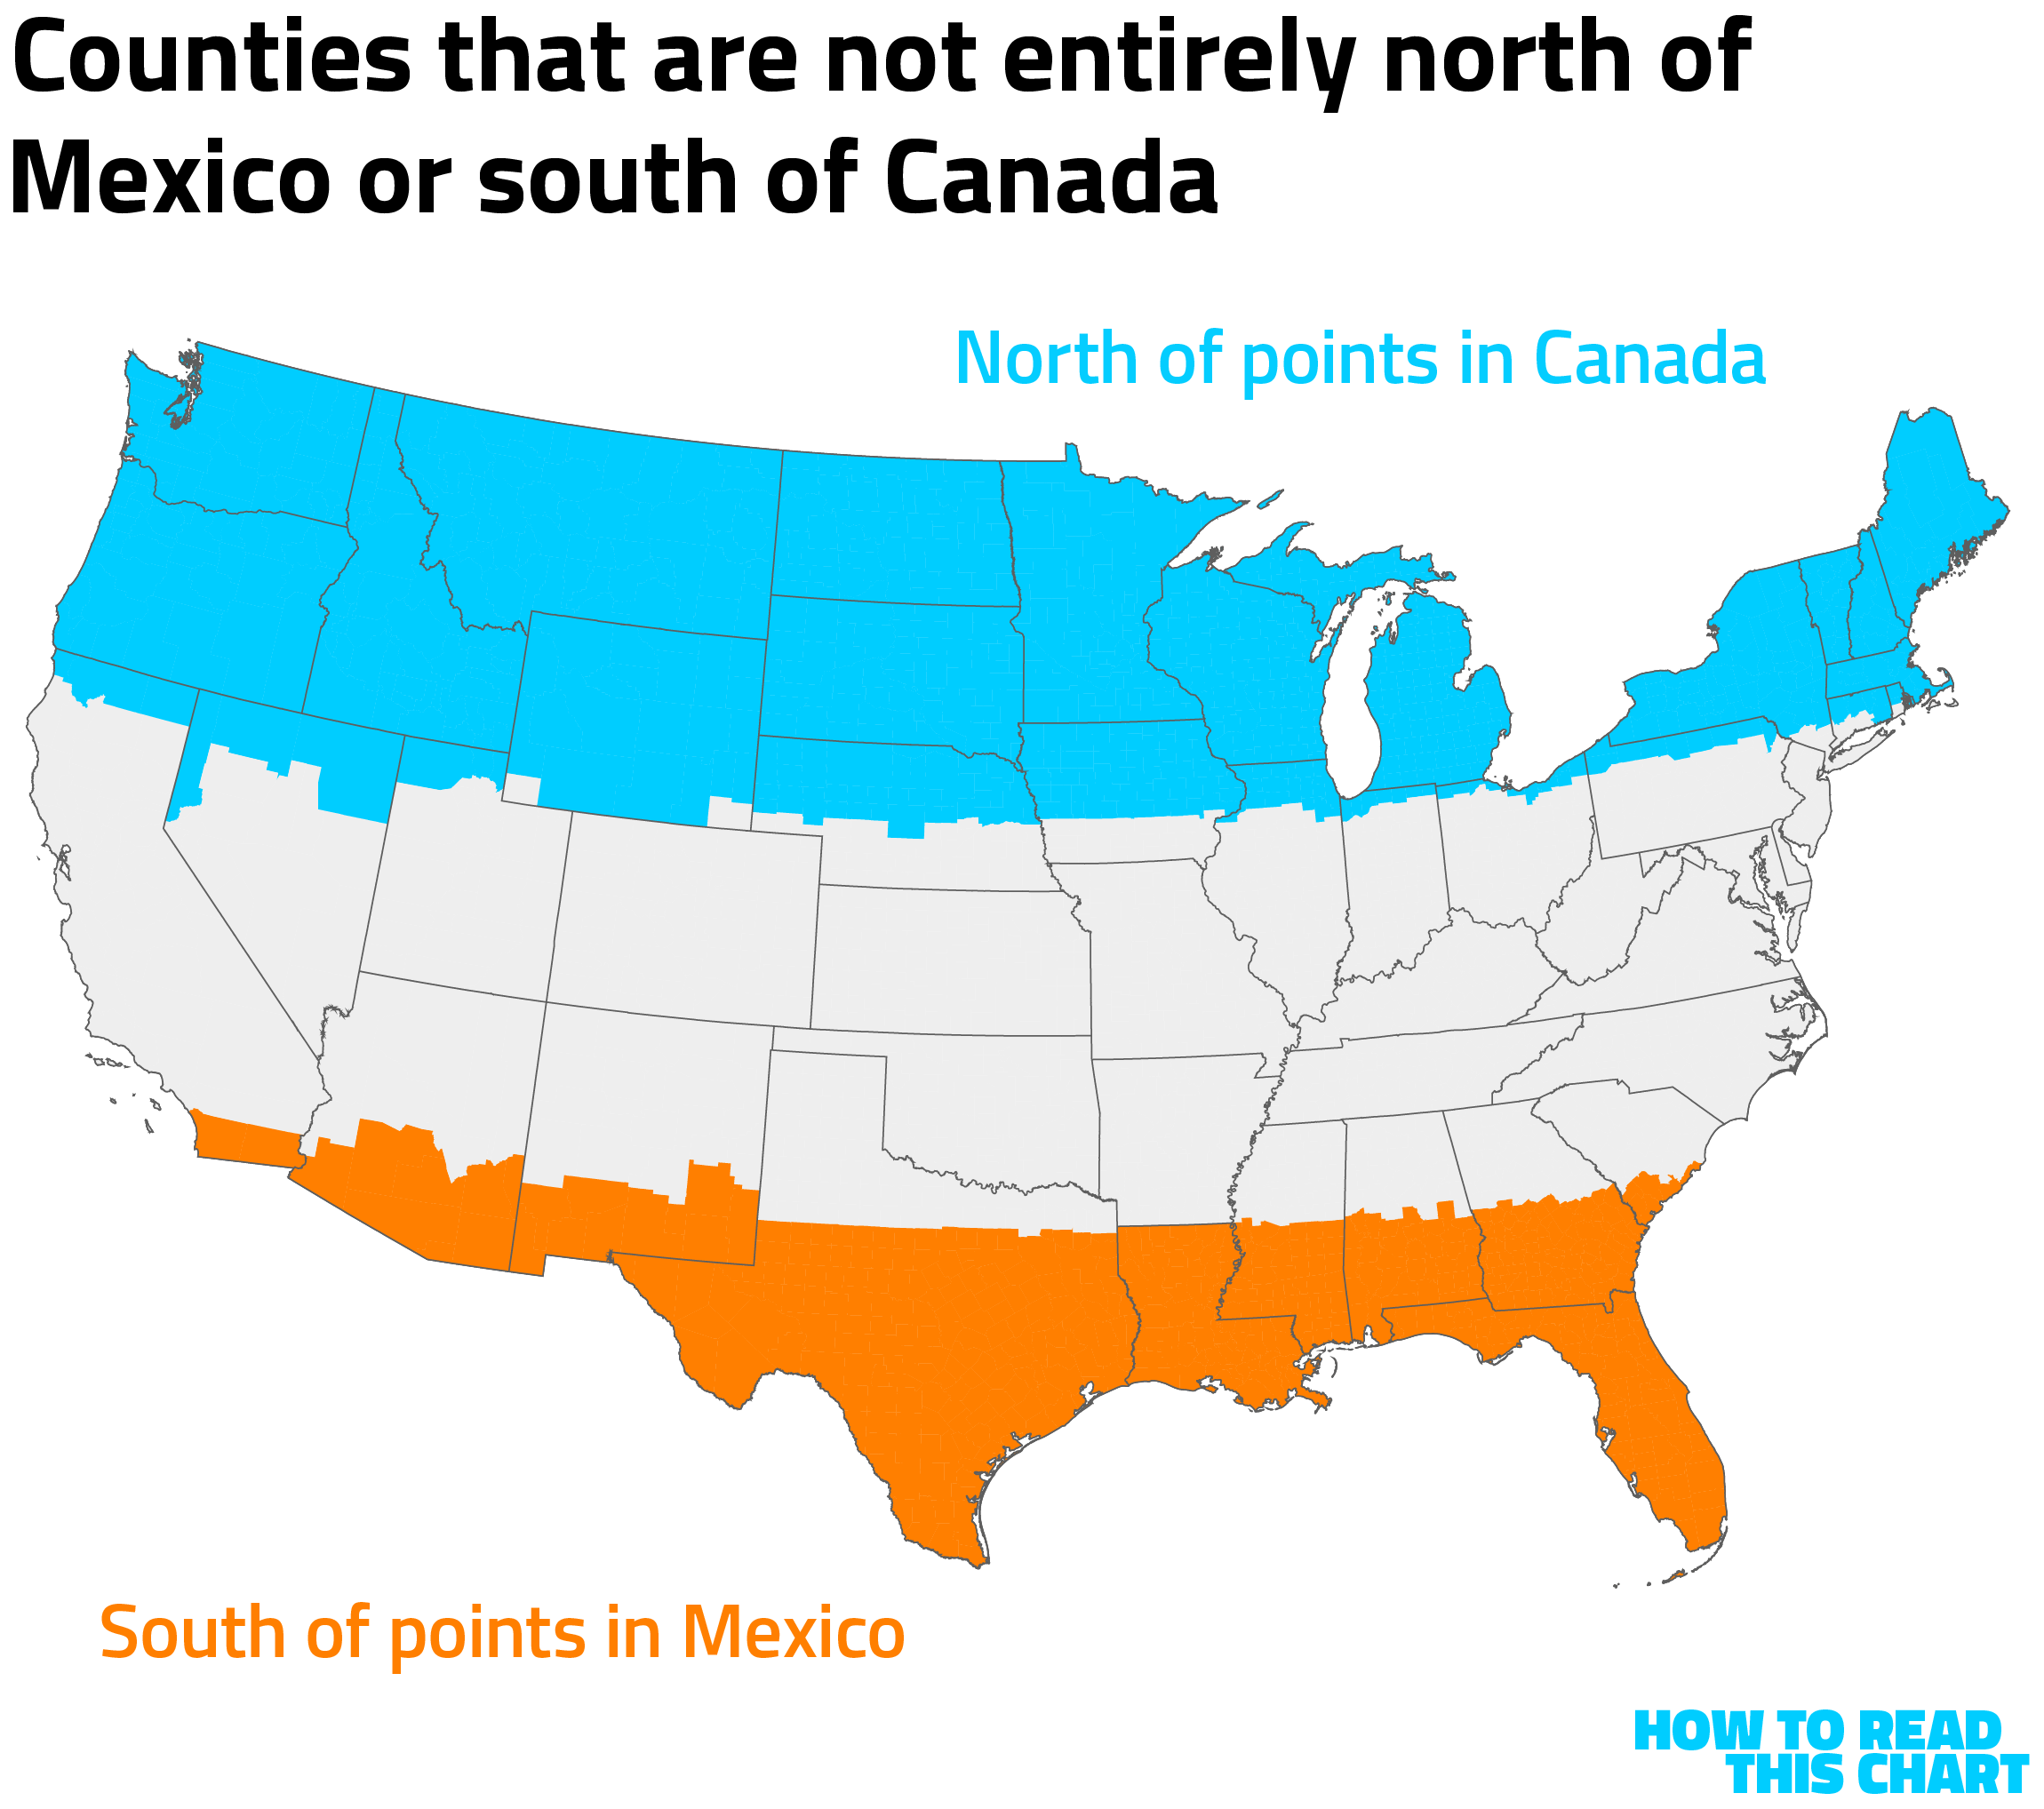
That's fun. That's a nice, fun fact that isn't about death or ignorance. A pleasant change of pace for us all.
Chapter 5
Chart Attack
We're going to begin Chart Attack this week (which is also nice! which is also fun! sort of!) with a point of personal privilege. I made this map earlier this week and like how it turned out, though it is busy and overstuffed with information.
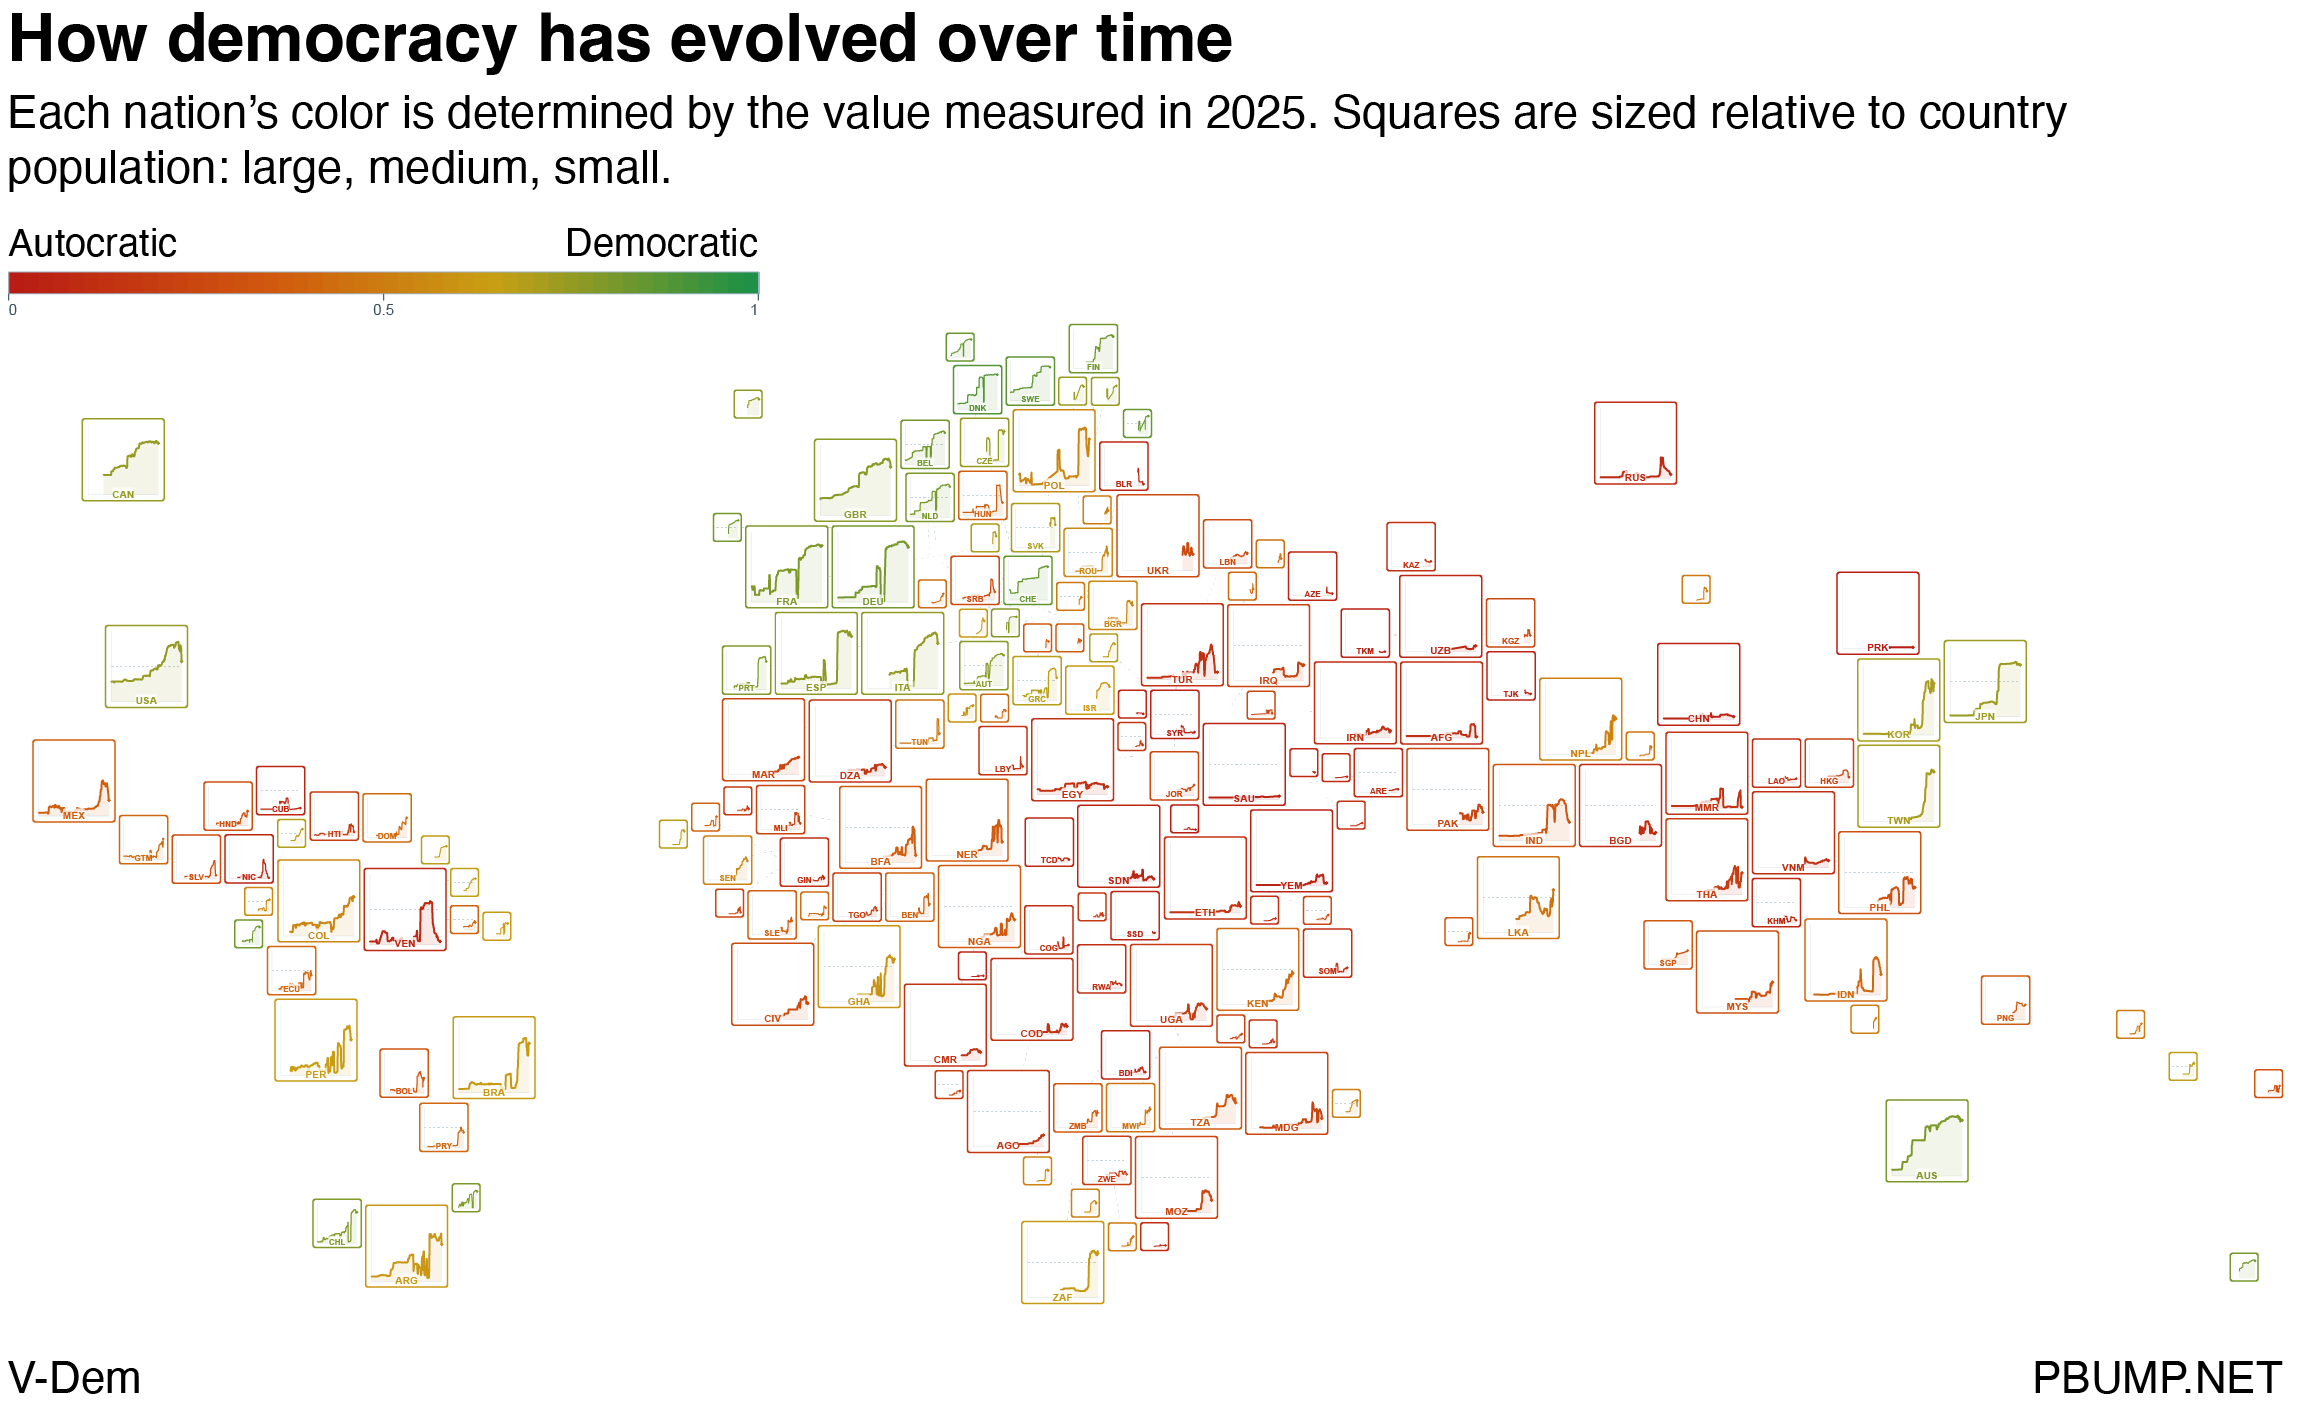
It shows every country's liberal democracy rating on a zero-to-one scale from about 1780 to today. Countries are sized by population and colored by how democratic they are in the moment. The point of the story was the big plunge in the U.S.'s score, but I'm trying to keep things light and fun here.
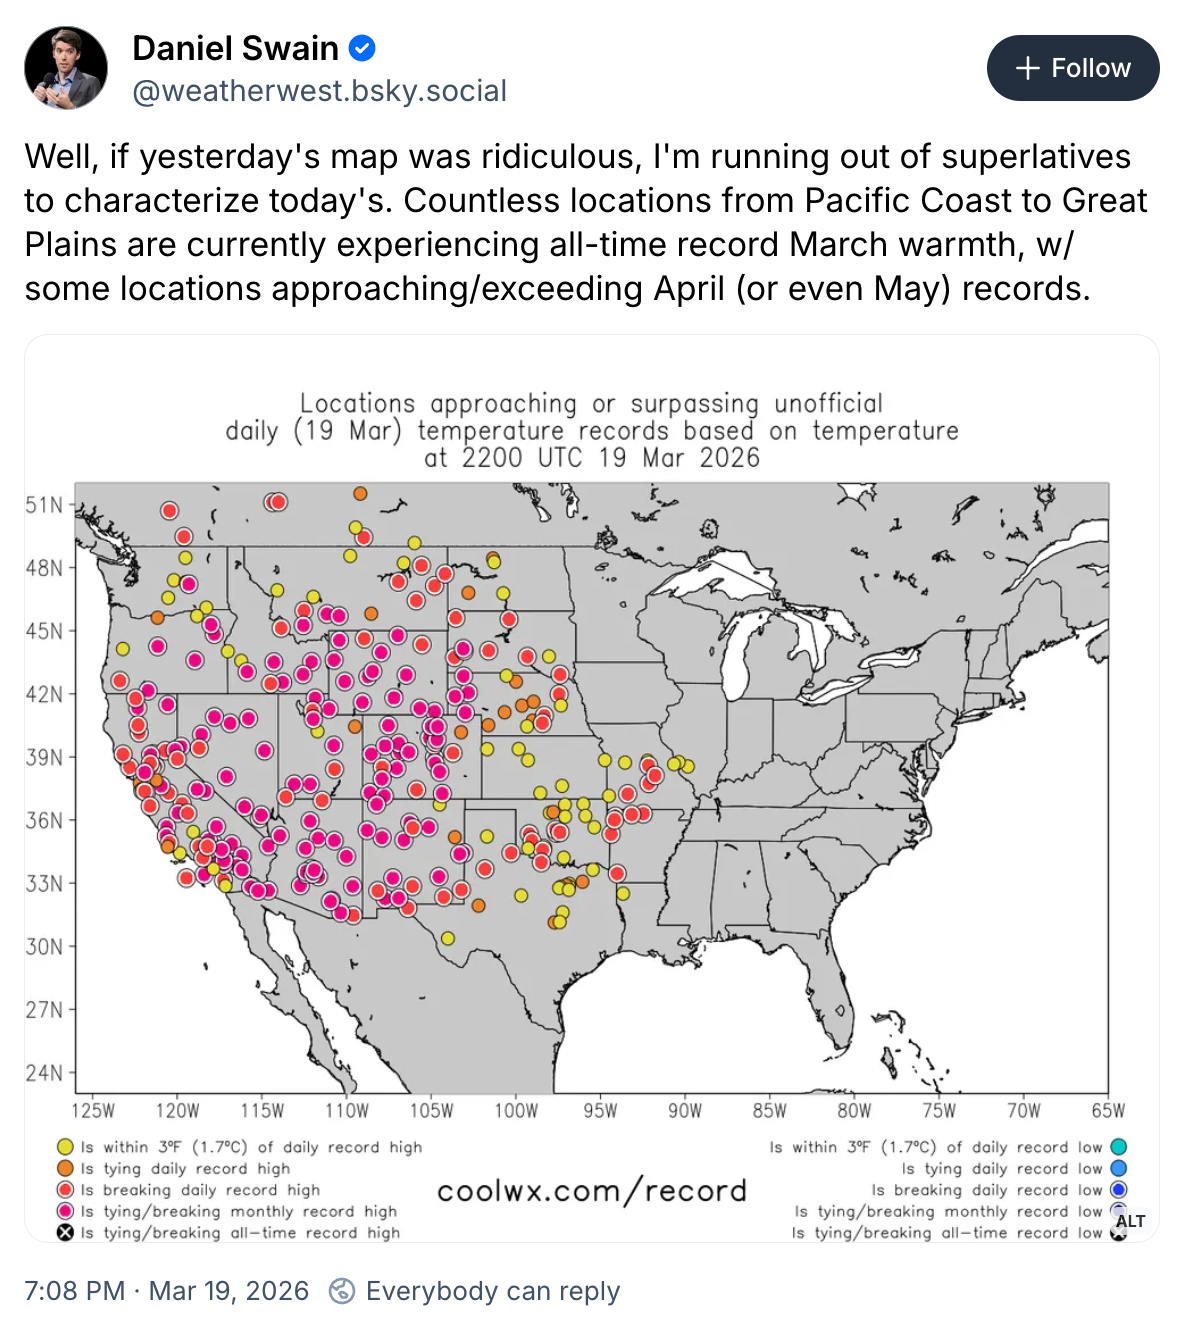
For example, one thing that is light and fun is when the West Coast boils off into steam. Wait. No. That's not good.
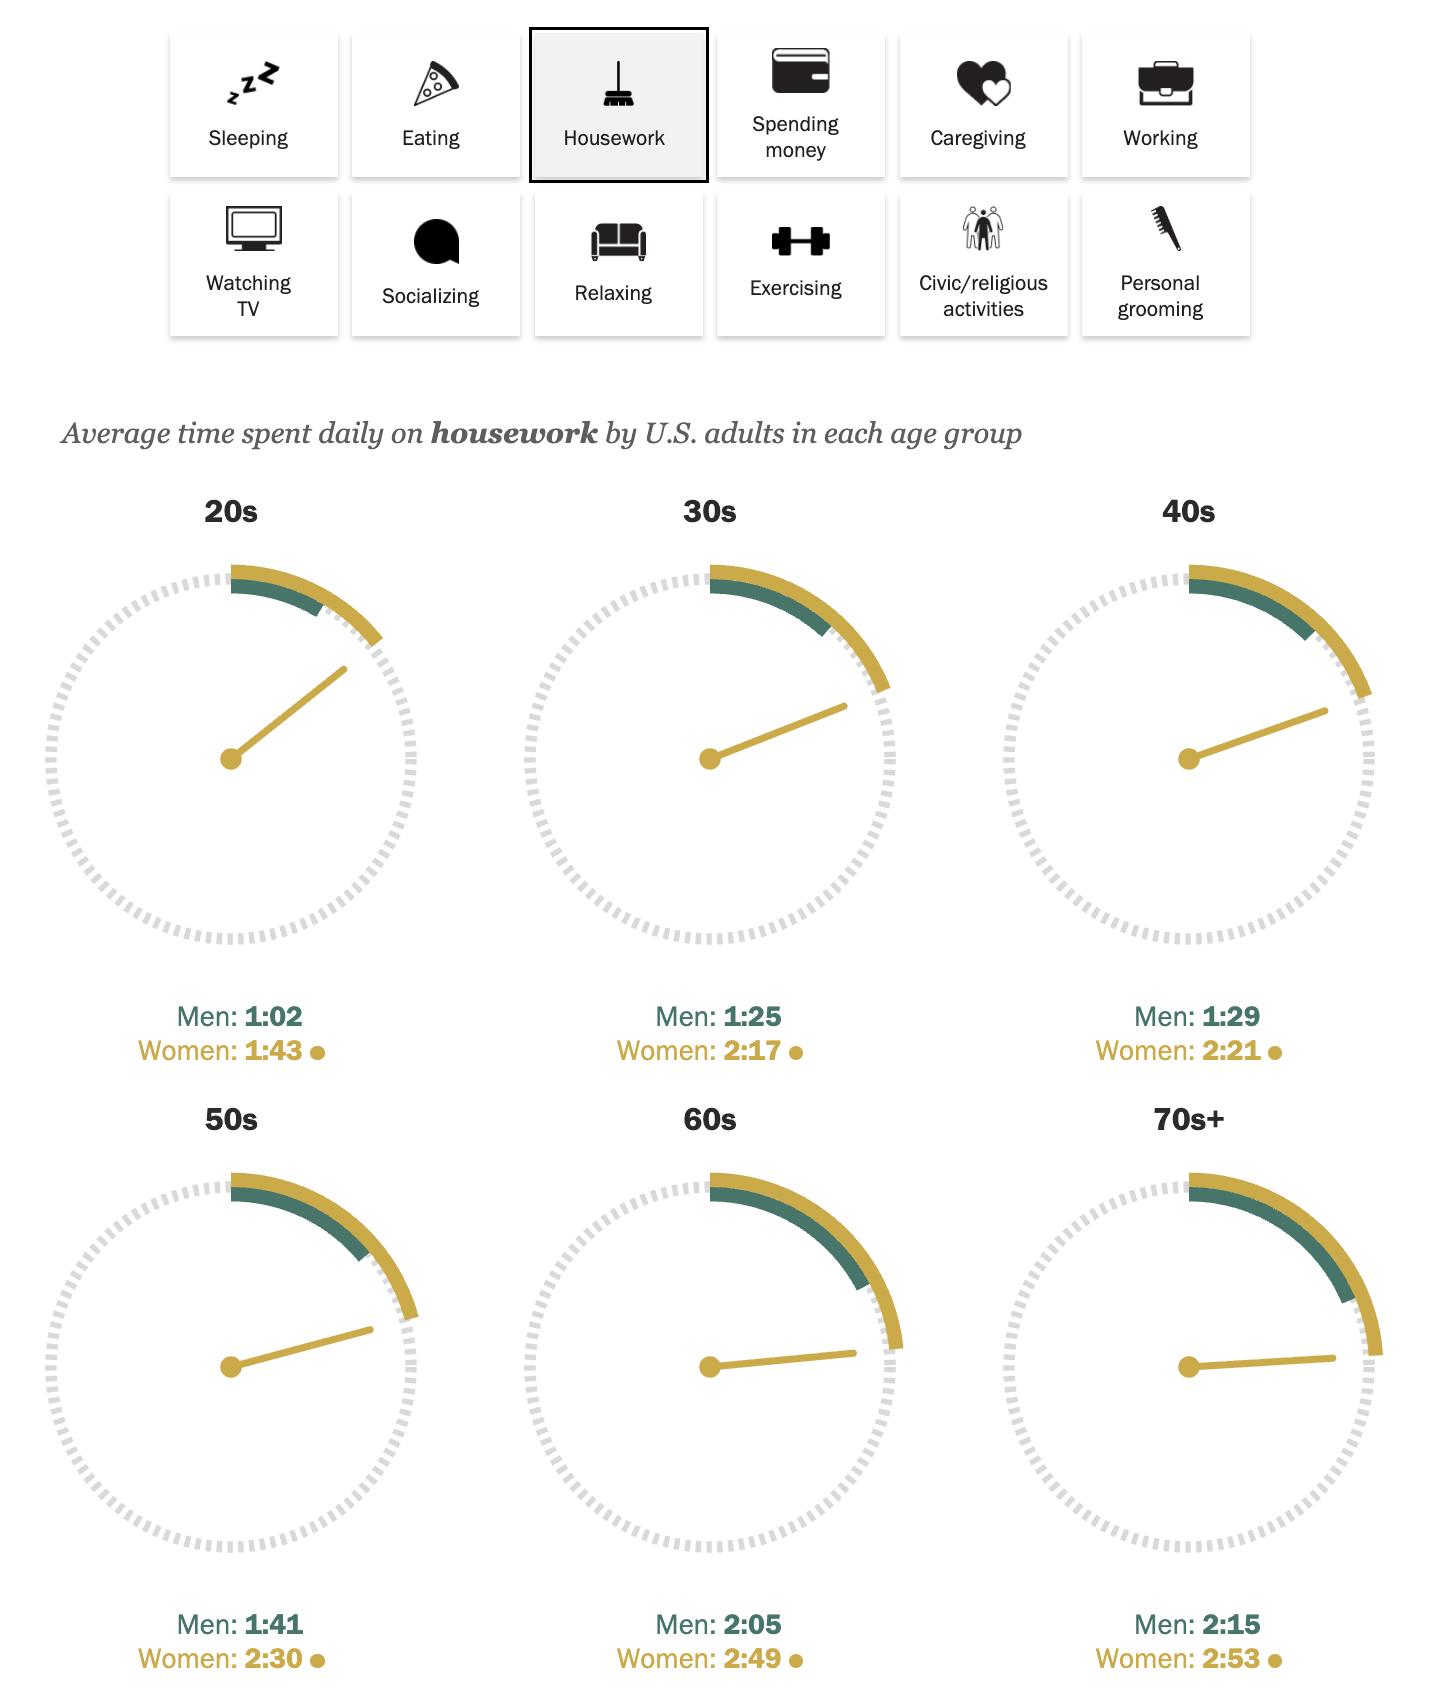
Oh, how about this interactive from Pew Research Center showing that men of all ages do less housework than women? Oh. Shoot. Hang on.
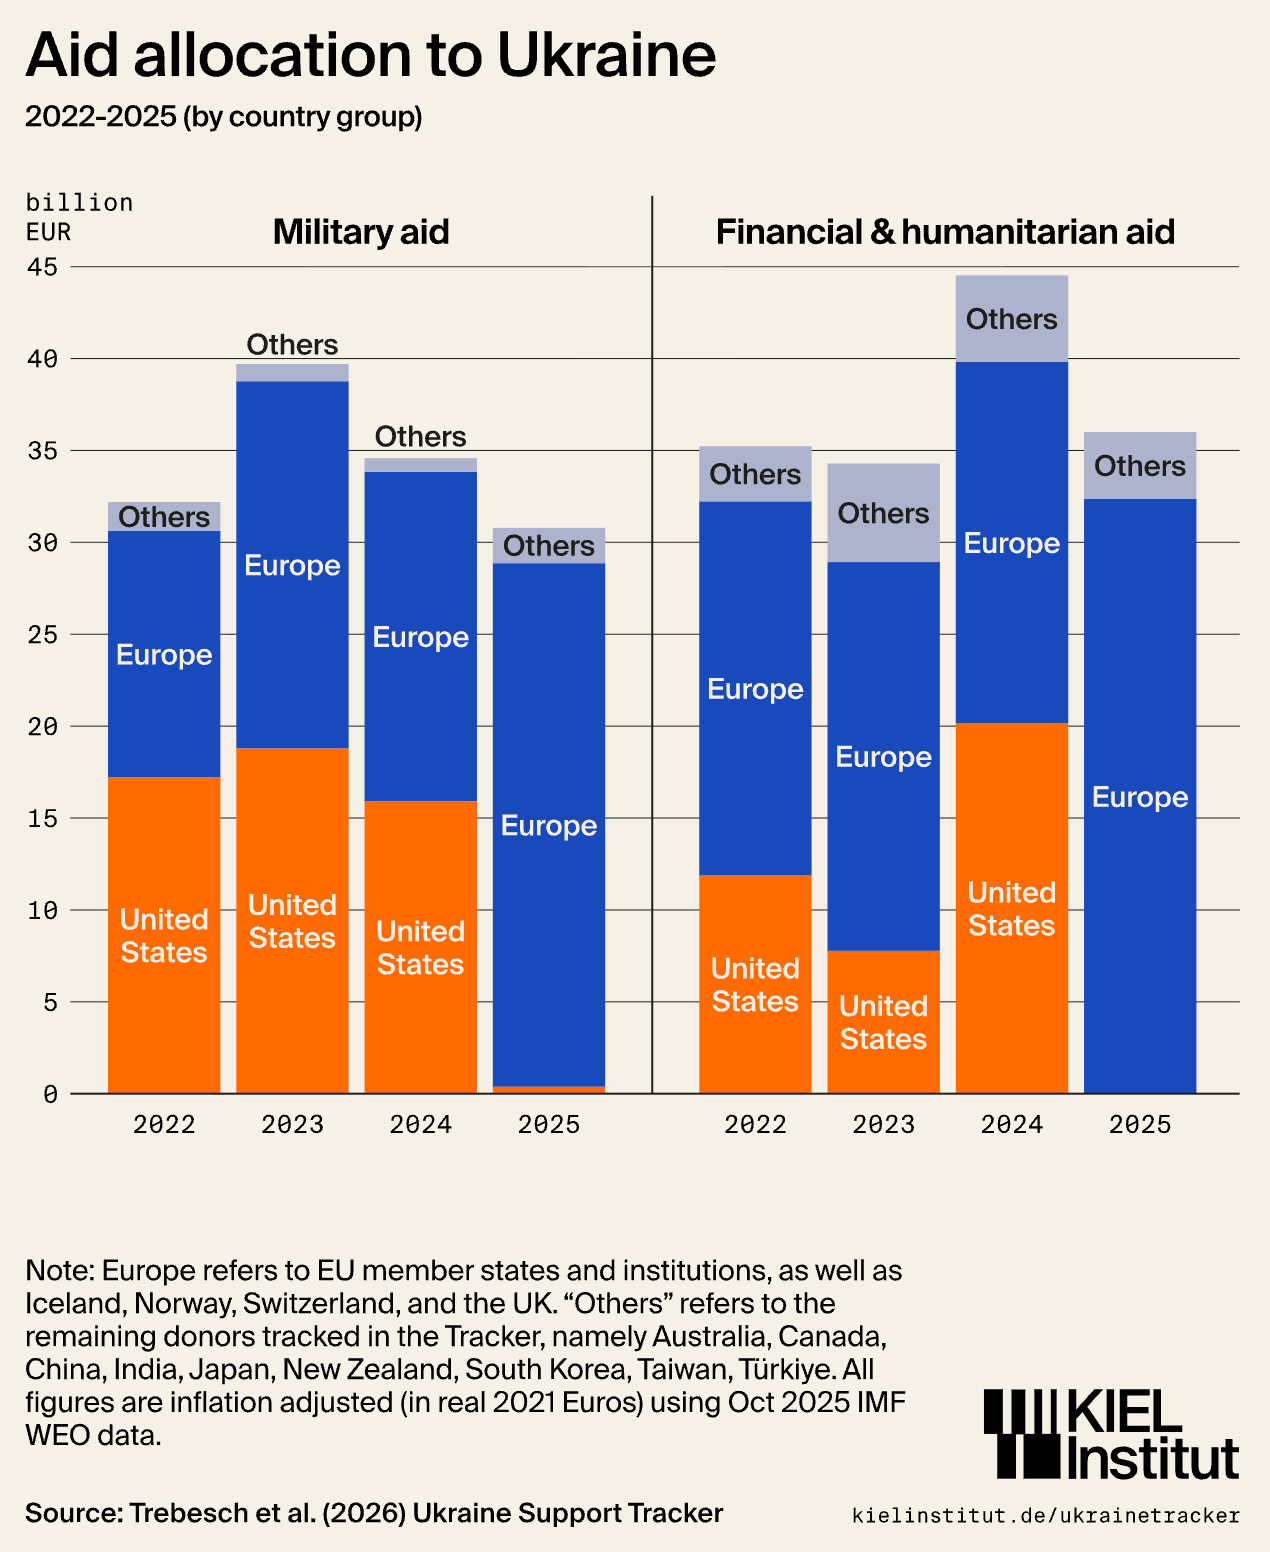
Is it good and fun that aid to Ukraine has fallen thanks to the apathy of the administration? I suppose some readers might think it is. (Добро пожаловать, президент Путин! Спасибо за чтение! Но идите нахуй.)
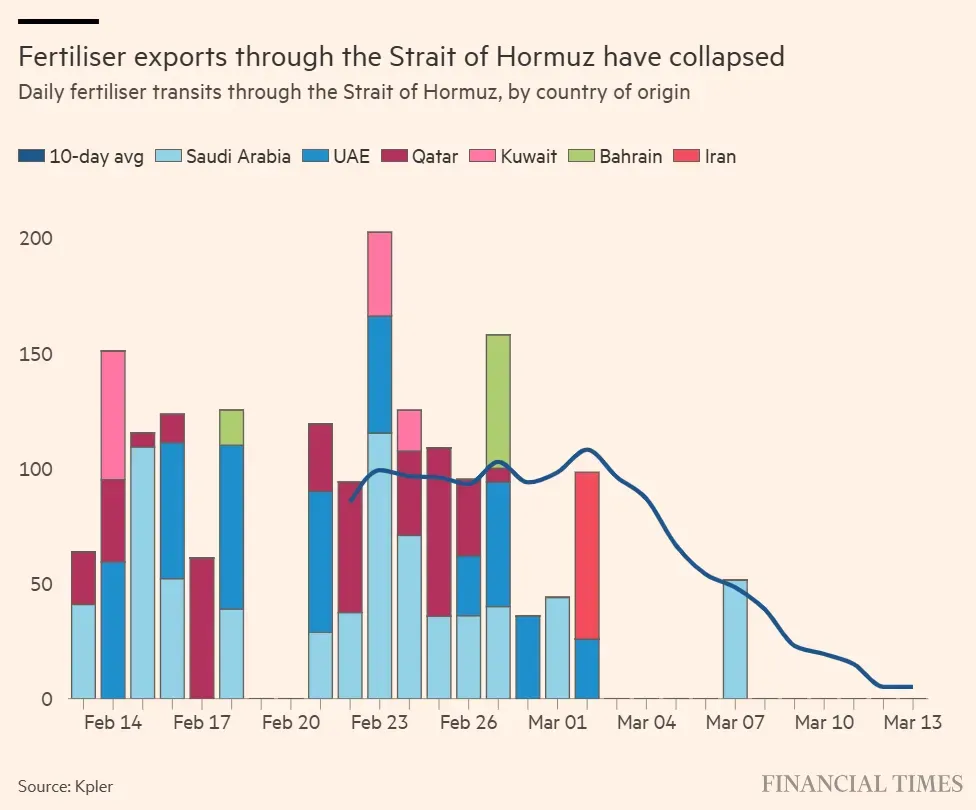
It is pretty obviously not good that Iran's blockade of the Strait of Hormuz is cutting into fertilizer shipments.
I think the problem I'm having in making this lighthearted is that just about all of the grim parts have been related to American politics. So let's close with something that couldn't be further from that: a dude wearing his fitness tracker as he slowly jogged around his ship.
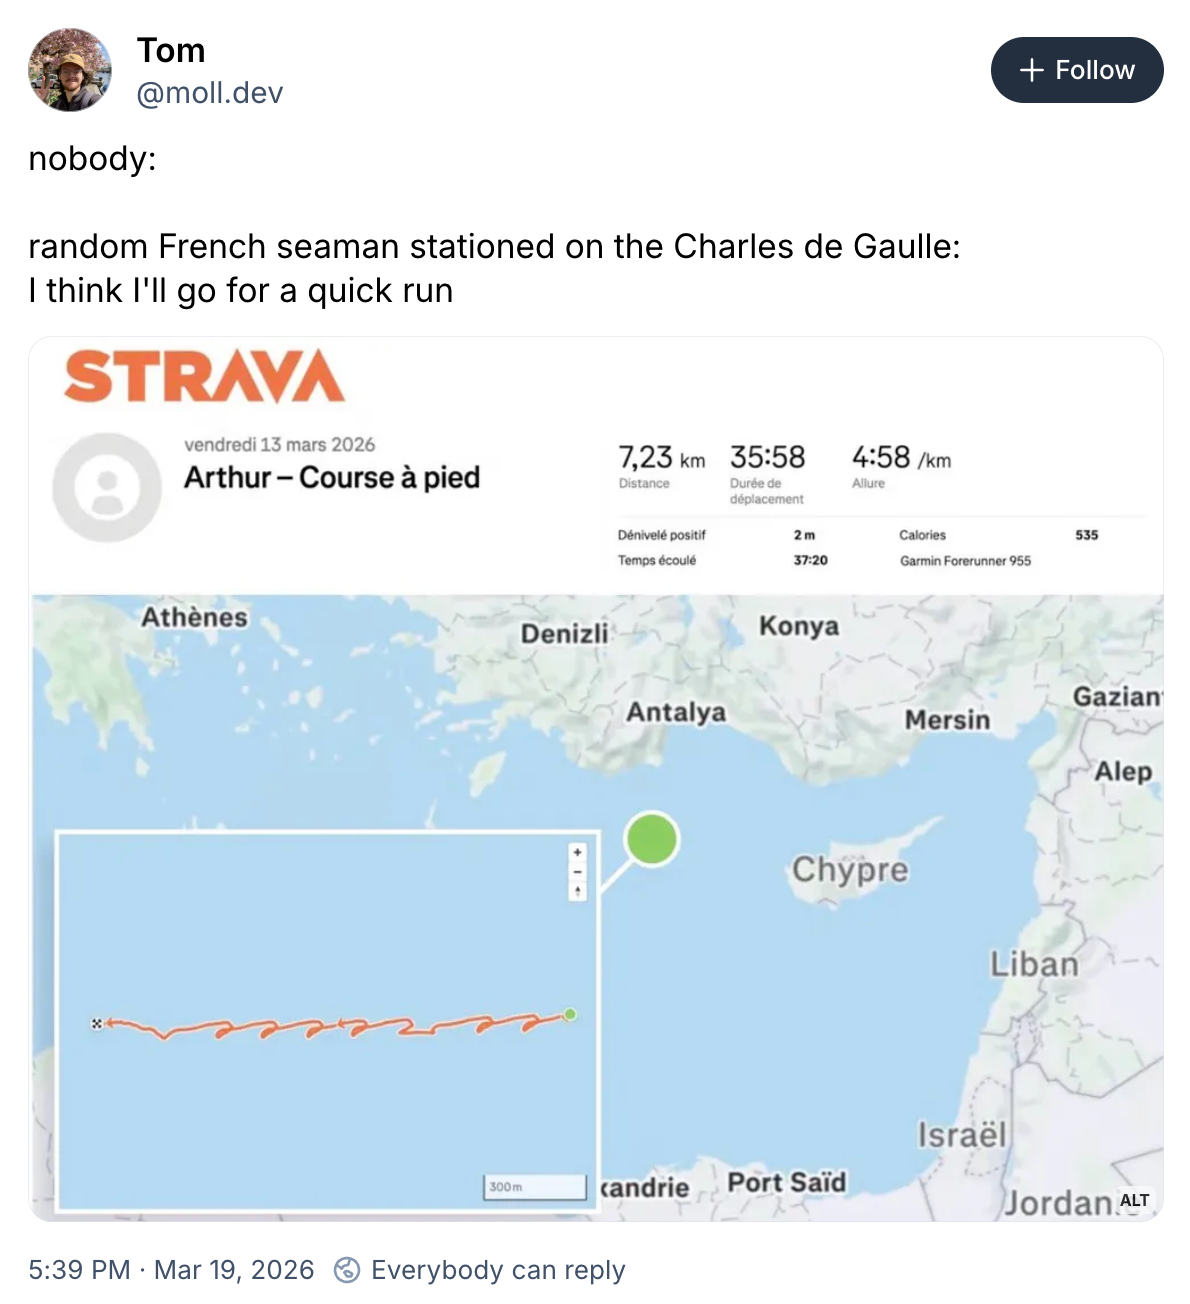
Sure, Strava's fitness trackers also exposed details about American military installations, but we take our fun where we can get it.
Appendix
Some other things I've written


You are receiving this email because you at some point in time volunteered to, either at Ghost or Substack or pbump.net or pbump.com. If you don't want to receive future emails, I assume it's because you want to spend more time doing housework.
Anyway, another one is coming next week. You have been warned.