There's no viz-ness like snow viz-ness


Look, I'm not happy about that joke either. But sometimes the creative process floats one over the plate and you just have to take a swing at it, earning a bloop single. Anyway, this week's theme is snow, which doesn't have anything to do with baseball, but the creative process can also pitch some nasty, unhittable stuff.
Chapter 1
When it has snowed in the past
I grew up in Rochester, in western New York. It's about an hour east of Buffalo, if you don't know, meaning that it is just slightly further away from the barrel of the gigantic snow cannon that is Lake Erie. While I don't remember a lot of massive blizzards as a kid, I do remember that snow was pretty much a constant during the winter. Enough to allow me to put off cleaning up after the dog for months at a time, for example.
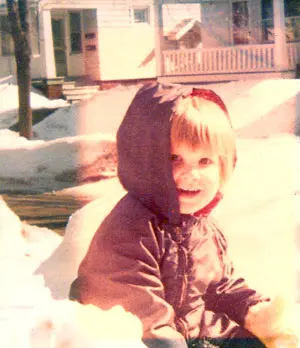
It was enough, too, to inculcate a sense that snow was proper. That winter, and the Christmas season in particular, needed it. When I lived in California, I certainly didn't complain about the climate, but every October or November I would start to feel snow pangs, ones that would probably have dissipated rapidly if I'd had to, say, shovel a driveway every day, but I didn't.
So every year, I also look forward to the first big snow, an occasion that is frustratingly variable in its arrival. But I am me, as you might have gathered, and that means that I determined to figure out when I could expect that first snow to occur.
The National Oceanic and Atmospheric Administration (NOAA) has collected data on precipitation (and temperature and all the other things you'd assume) at weather stations around the world for decades. This allows us to track weather events over time in a useful way — like when it first snowed each year.
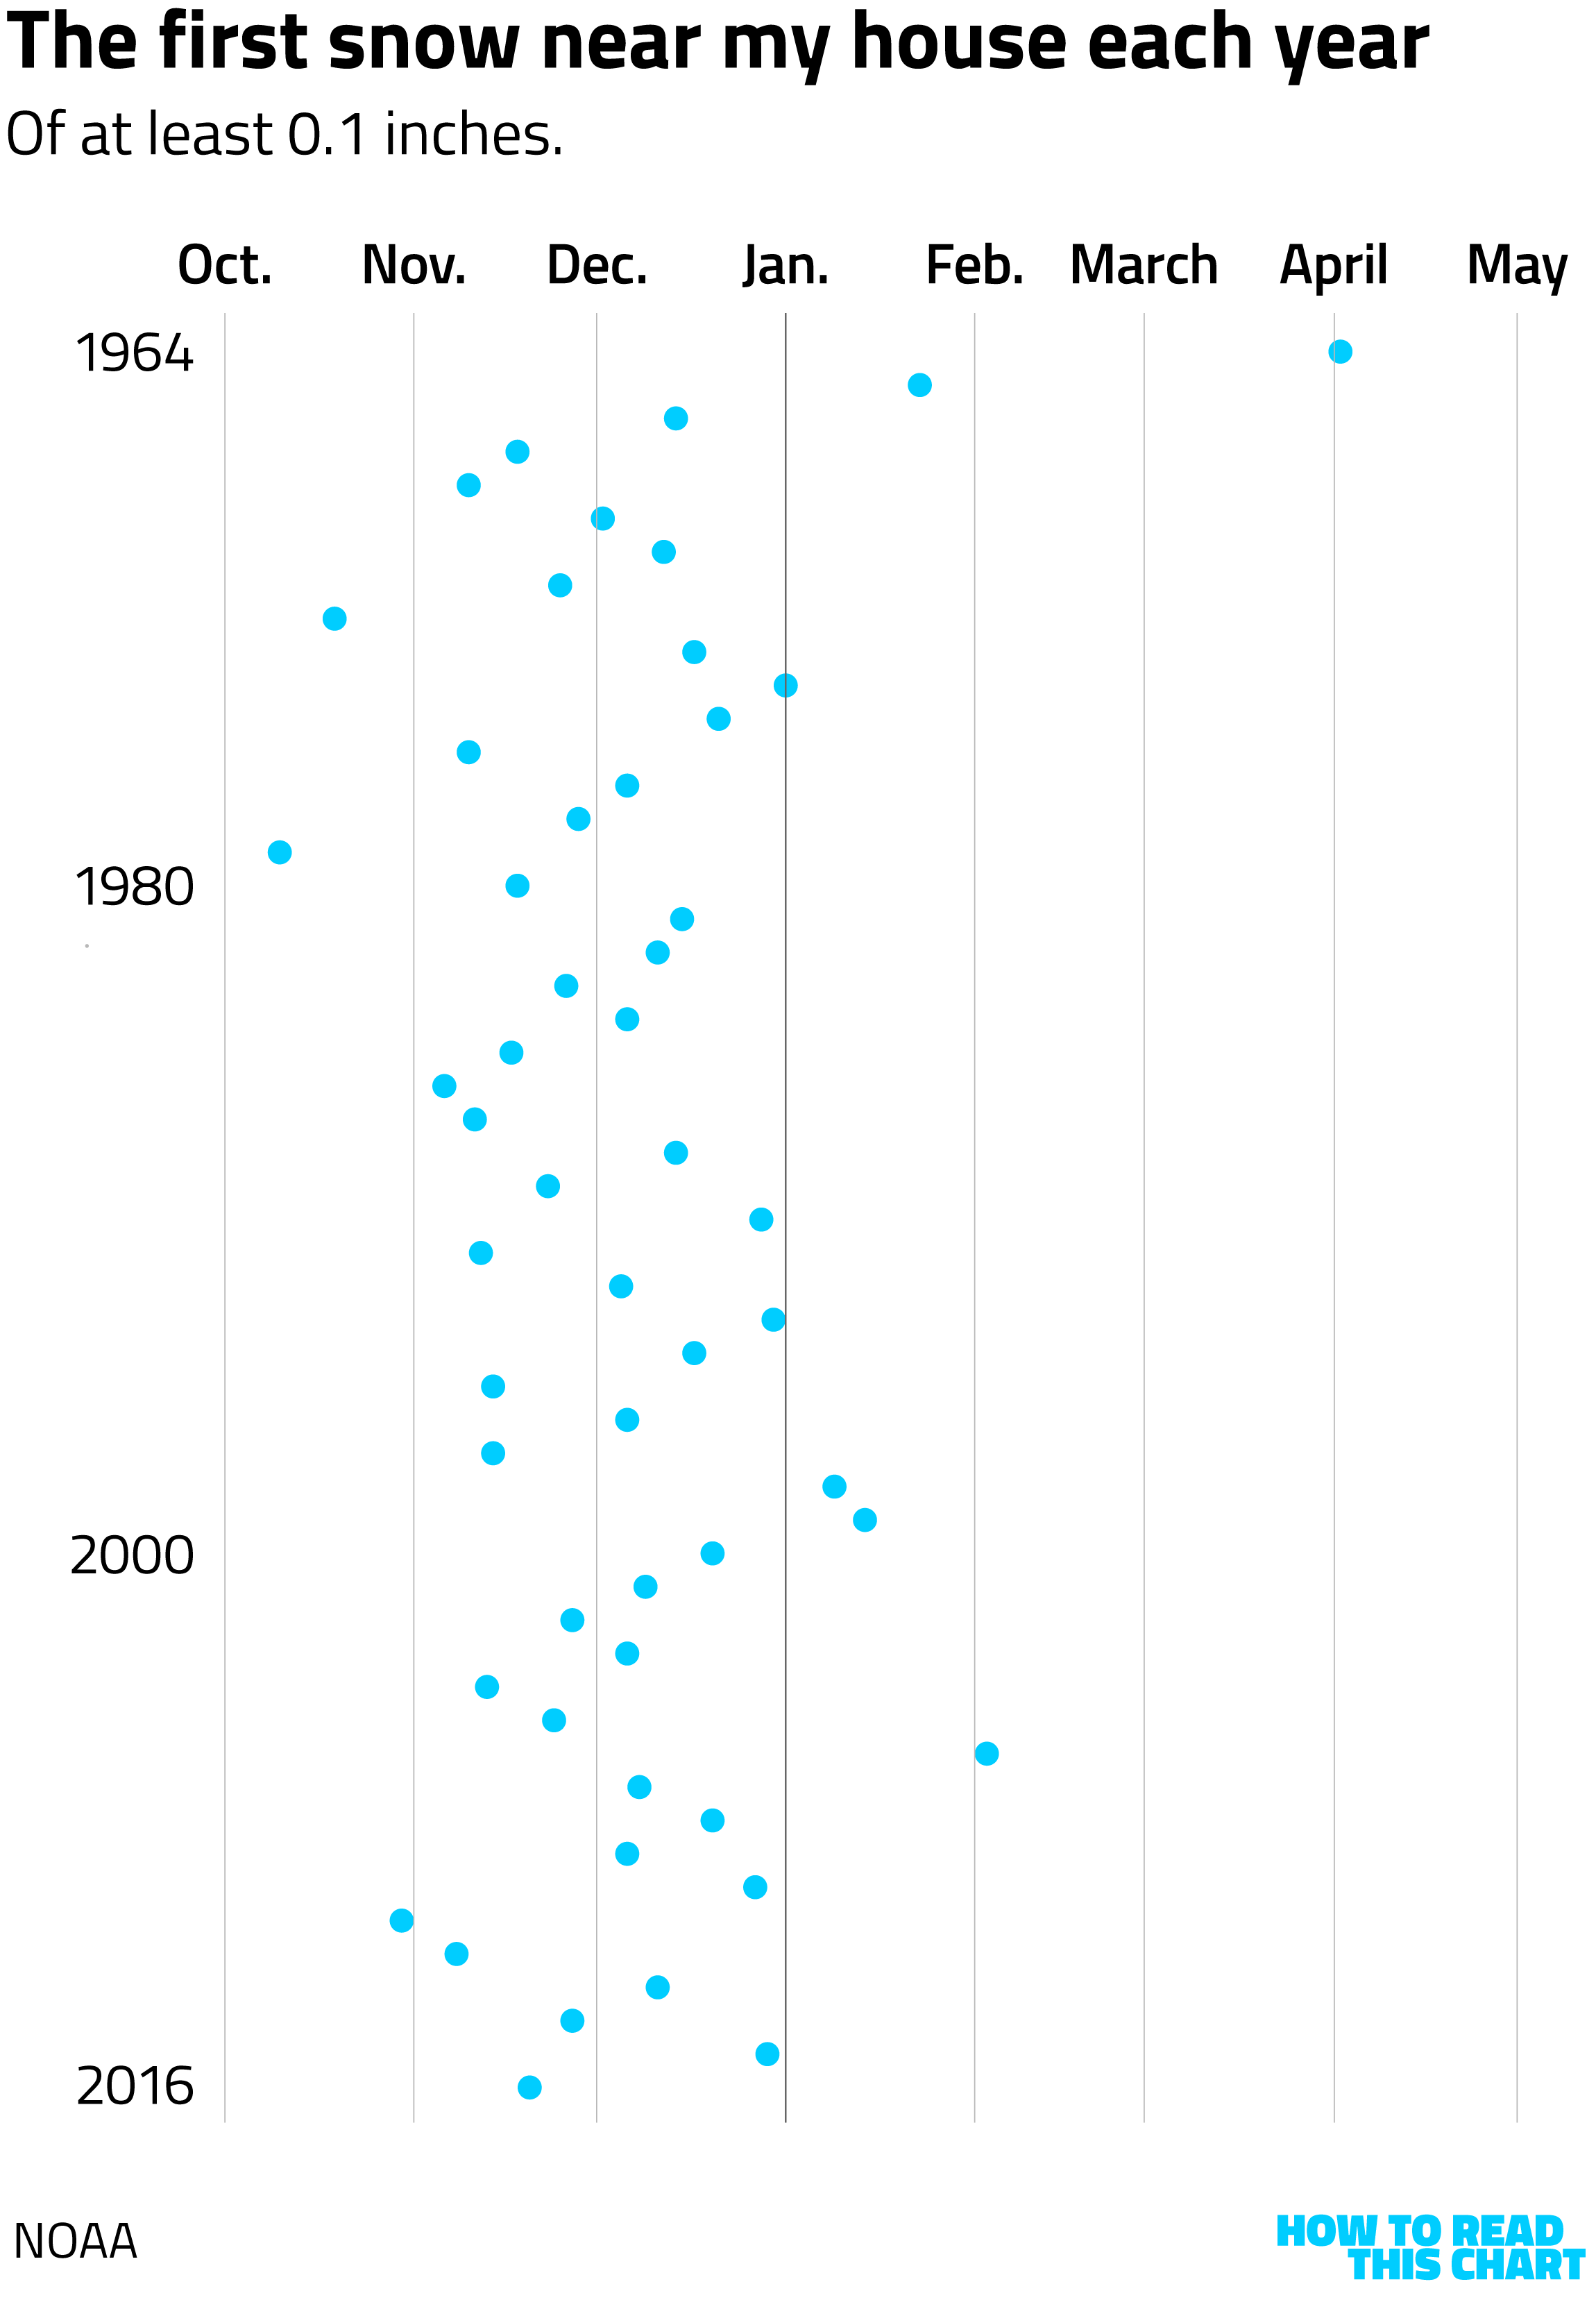
There are a few important caveats here. The first is that each station is or was in operation in a specific place for a specific period, meaning that there are often gaps. Another is that "first snow" is itself relative. Are we talking a dusting? A foot? As you can see, I set a baseline of a tenth of an inch, enough to cover the ground but not requiring an actual blizzard.
You can also see that there's a lot of variability. One year, the first snow wasn't until April. In another, it came in early October. You can also see that the earliest snow seems to have shifted later in the year, perhaps hinting at a pattern that we'll come back to.
But enough about me! I also pulled data from the 70,000-plus historic weather stations in the continental U.S., some 40,000-plus of which have records of snowfall. So here are the earliest and latest snowfalls on record near you, assuming you can find where you live on a static map of the lower 48.
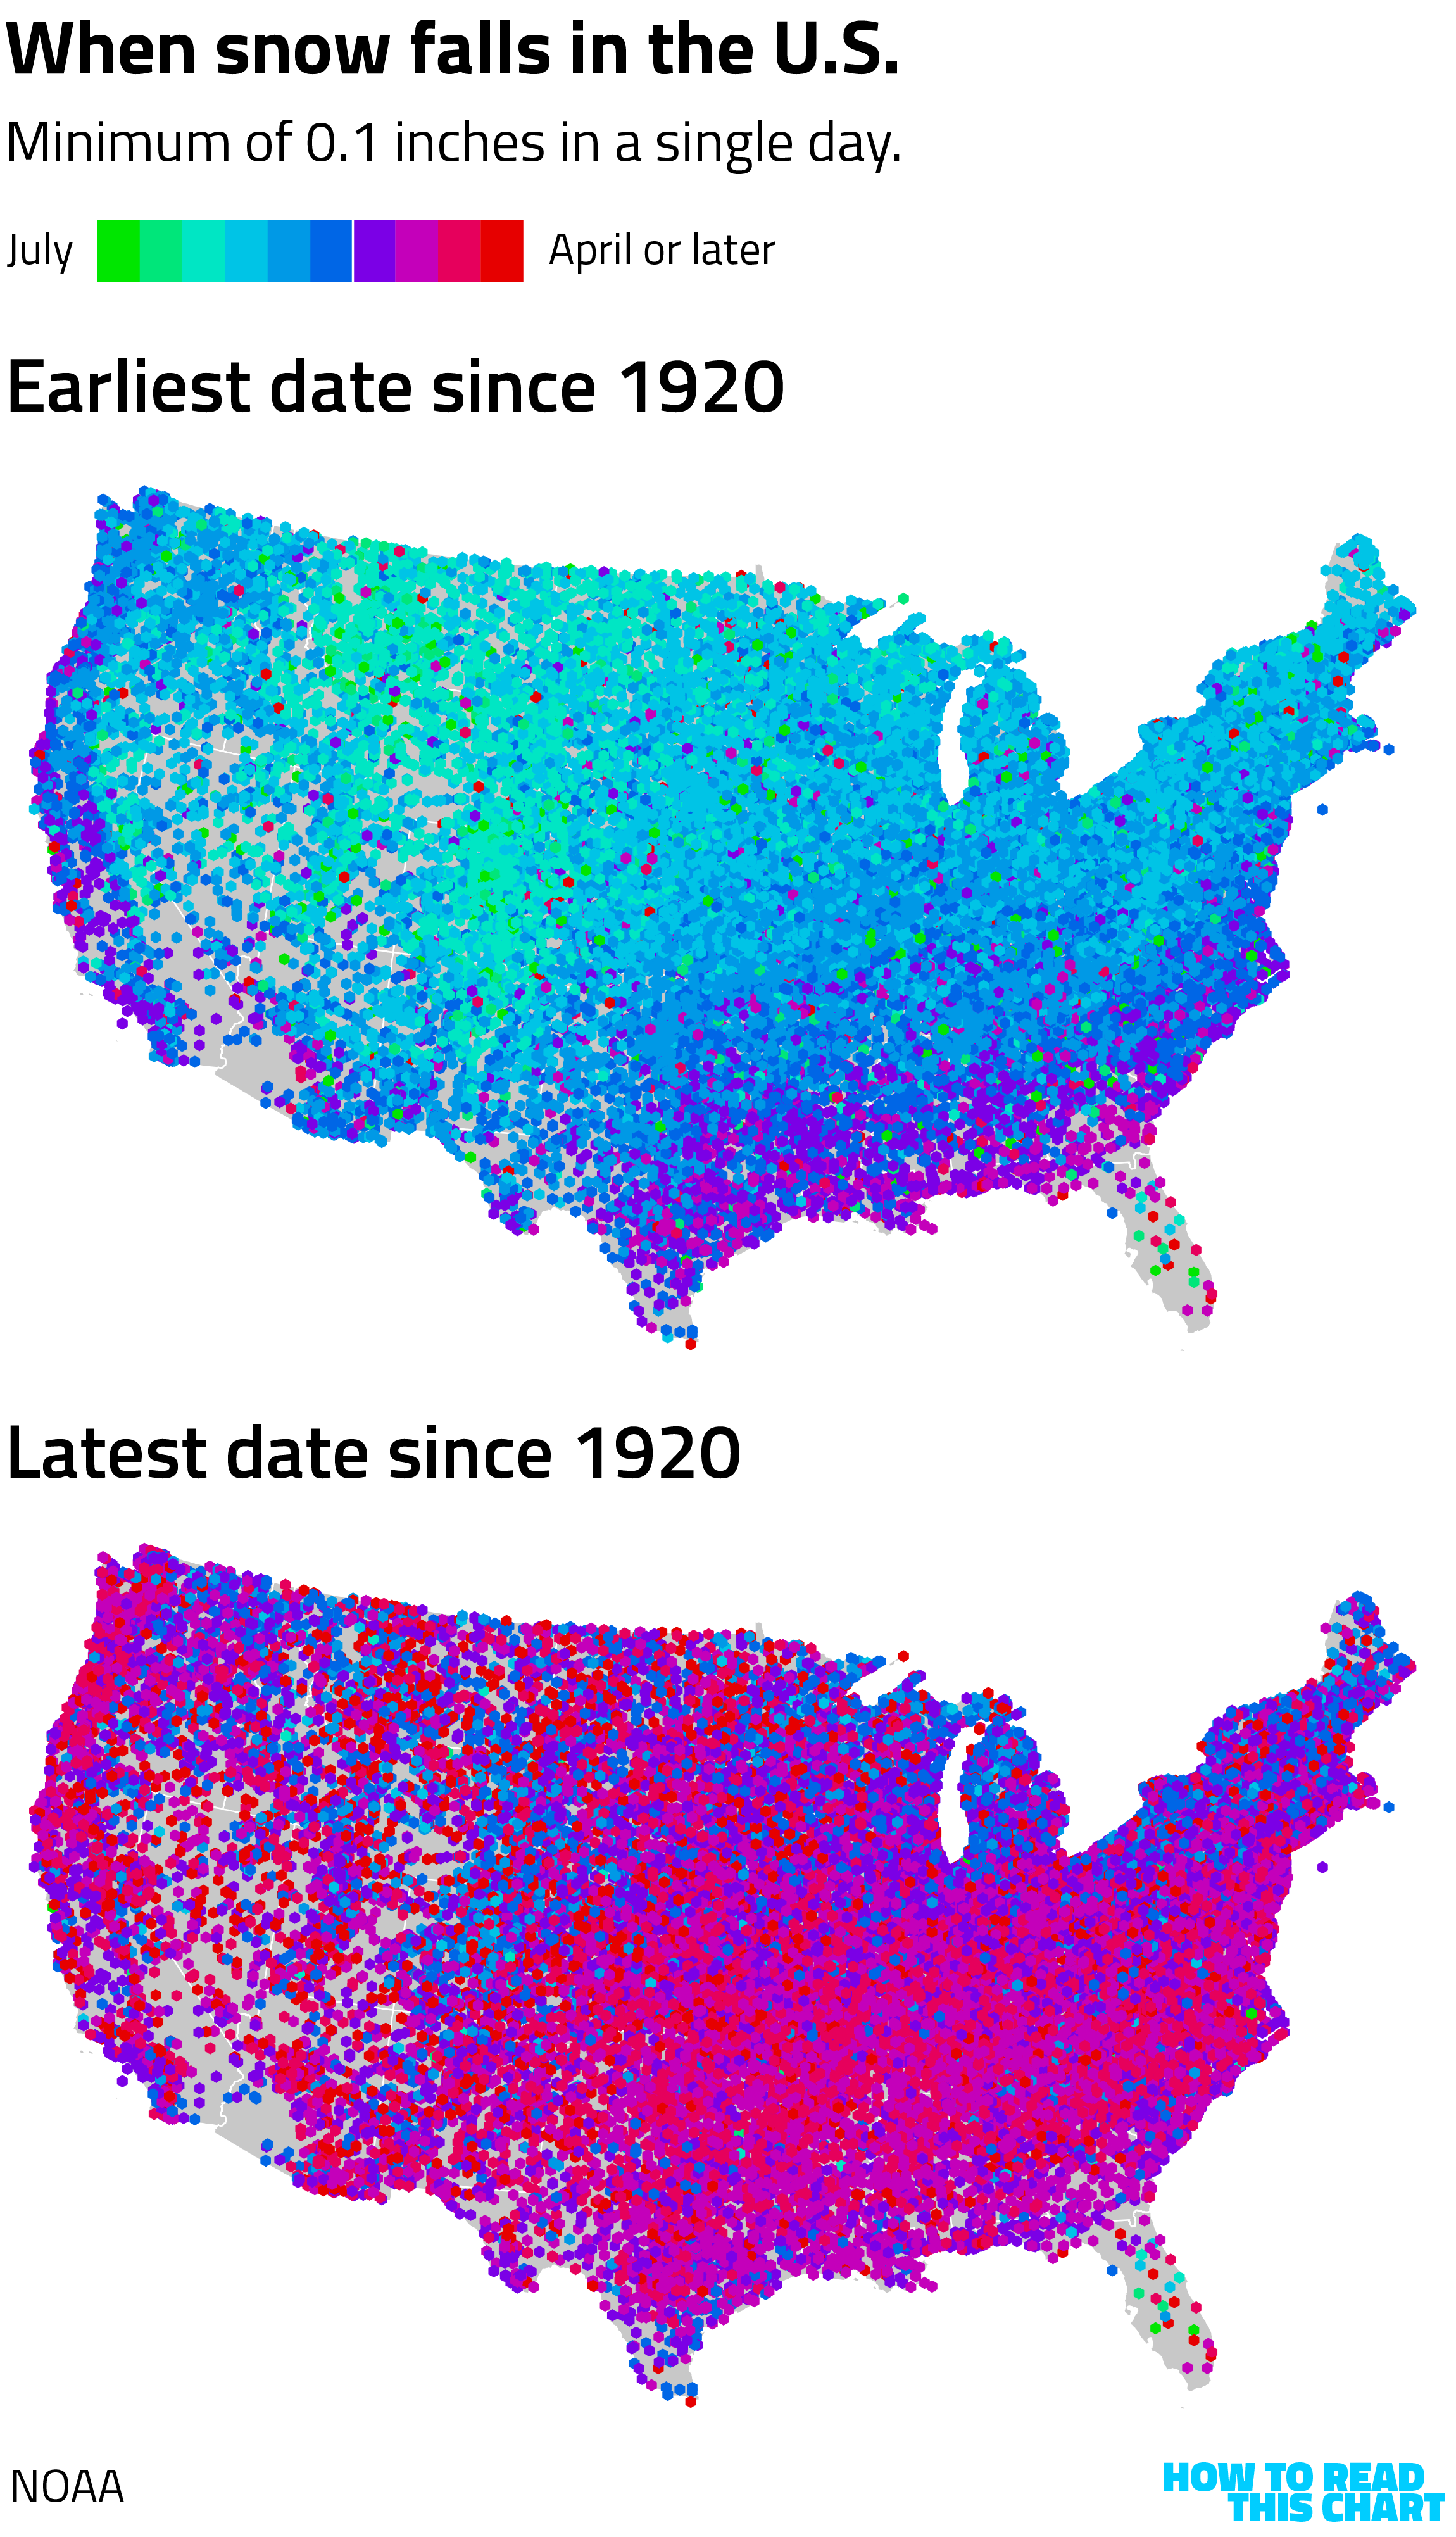
As an aside (and in keeping with the putative intent of this newsletter), it was a pain to figure out the color gradient for these maps. I needed to make it easy to differentiate between early, middle and late snowfalls but also effectively capture the regional patterns. The final result is imperfect, but I think it works?
Anyway. What's interesting about the first map above is how you can see both the snow-heavy Rockies and the snow-less parts of Arizona and Florida. You can also see that there are a lot of outliers, little red dots (meaning later first snows) in a sea of blue (earlier ones). This is generally a function of stations with fewer historic records.
Now back to the change over time. To illustrate that, I made maps showing the average first snowfall by decade across the country. The number of stations with data, you will see, varied by decade, making comparisons imperfect.
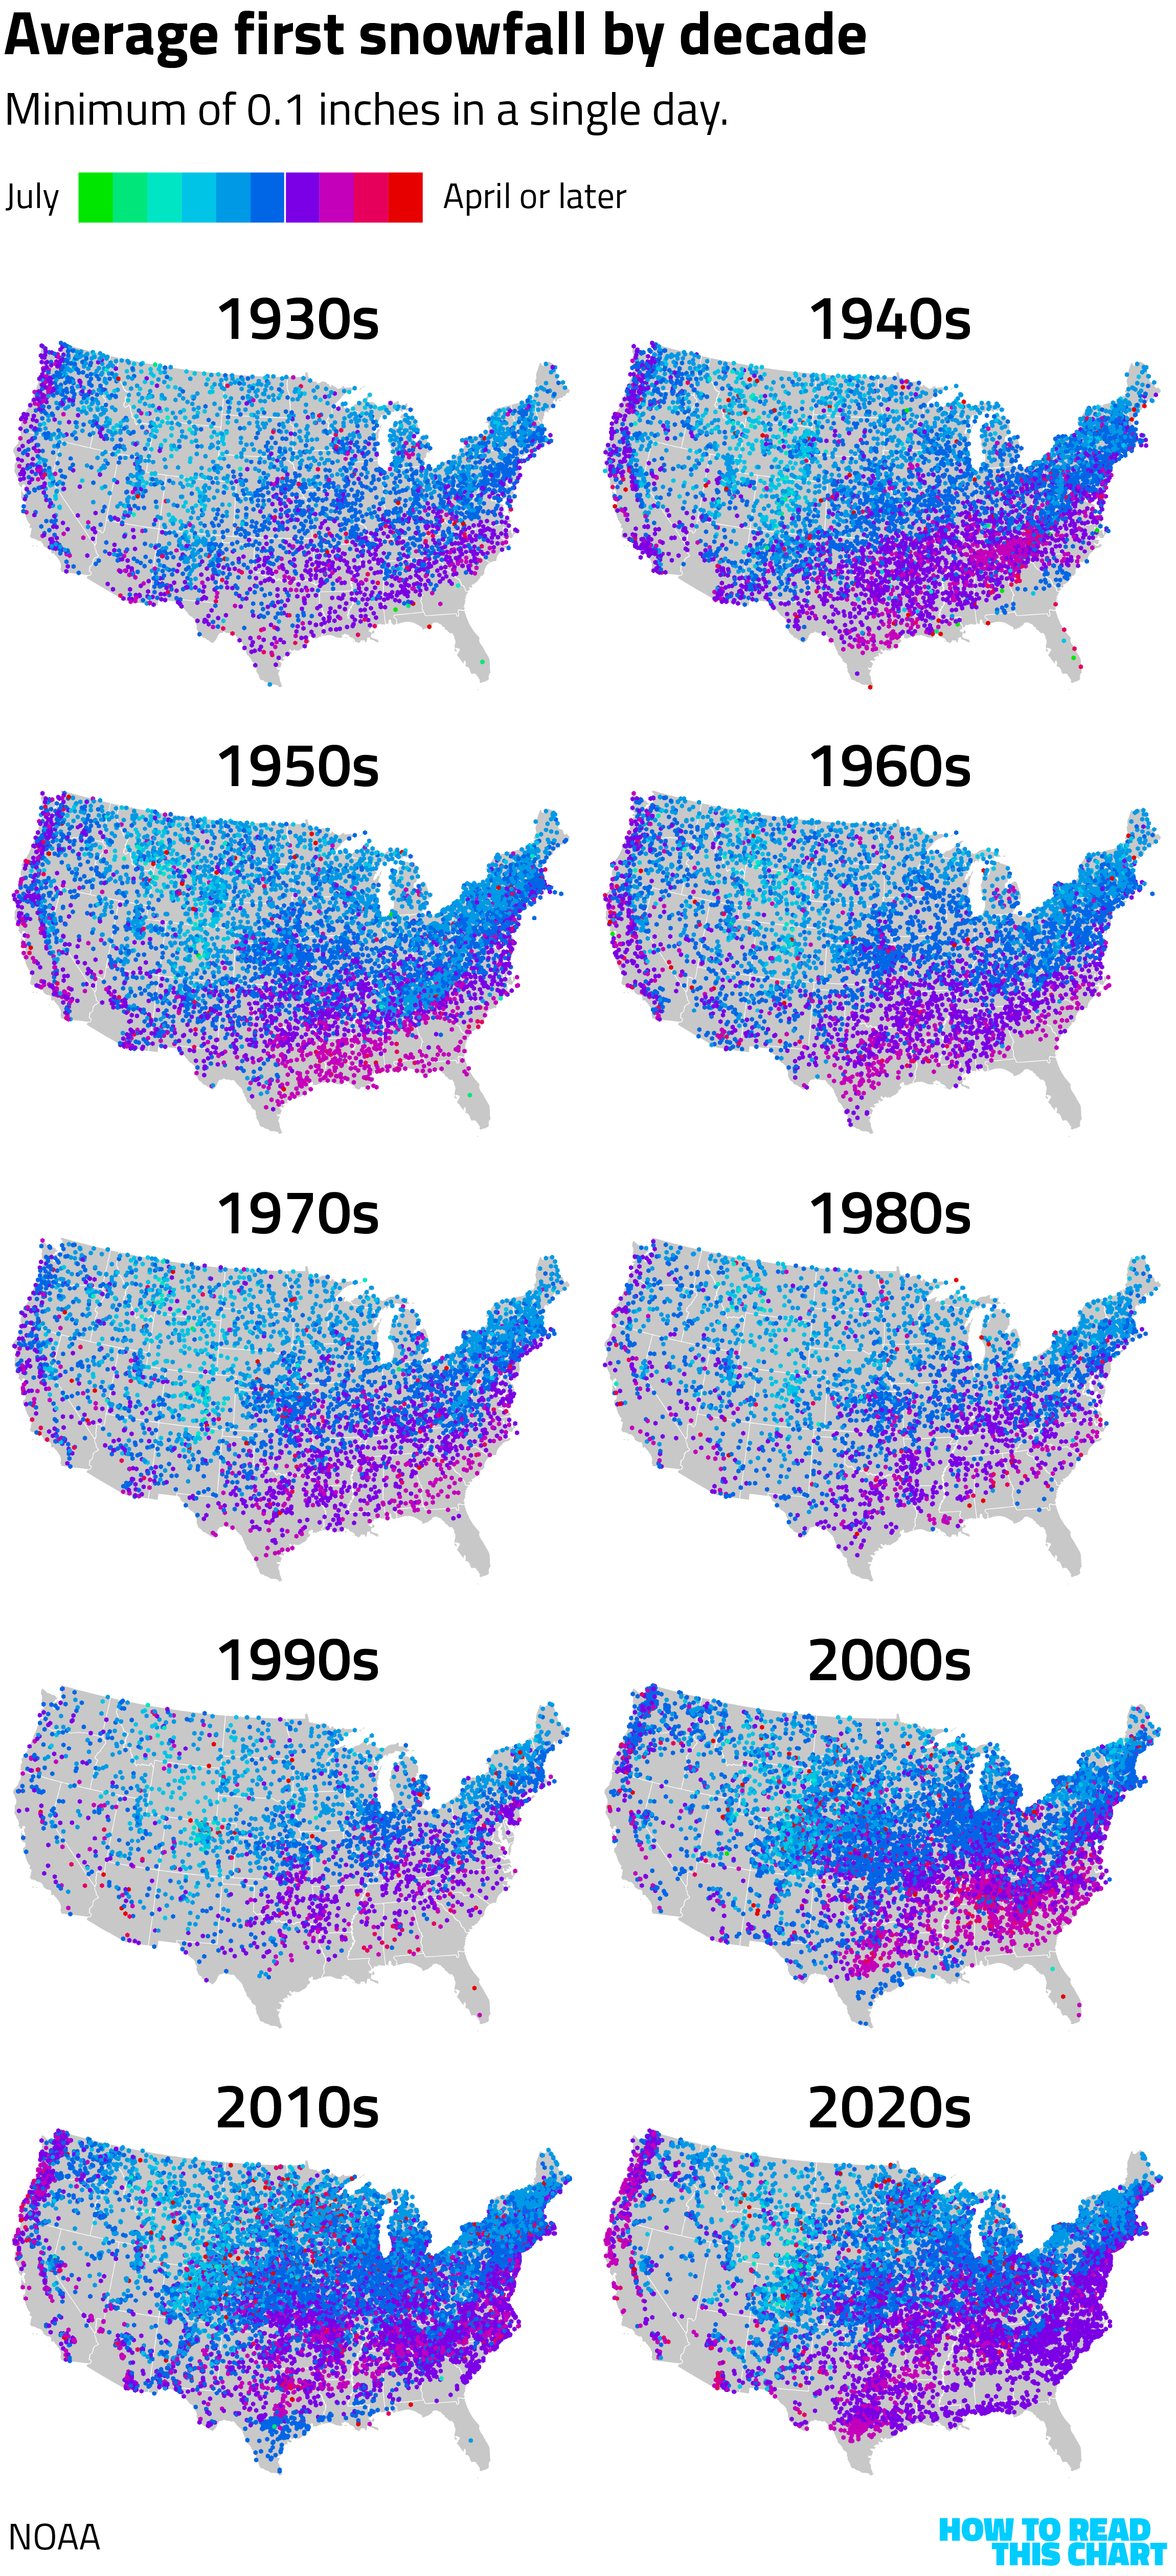
If we overlay the 1920s and 2020s directly, you can see only subtle changes (in part because there were fewer stations a century ago). As the NOAA has explained, it's also the case that the process of recording snow totals has become more rigorous over that period.
If you're looking for clear evidence of climate change, this is unsatisfying. A bit more purple in the upper Midwest, maybe, and a bit more red on the West Coast. But we don't need to rely on this data to show how the world is warming. We just need to wait until Chapter 4 of this newsletter.
Chapter 2
When it will snow in the present
As I eagerly awaited the first snowfall this year, I discovered a useful tool created by the New York Times. It does precisely what I wanted: offering up-to-date forecasts of expected snowfall in the continental U.S.
As of Friday, here's what the Times' snow map showed.
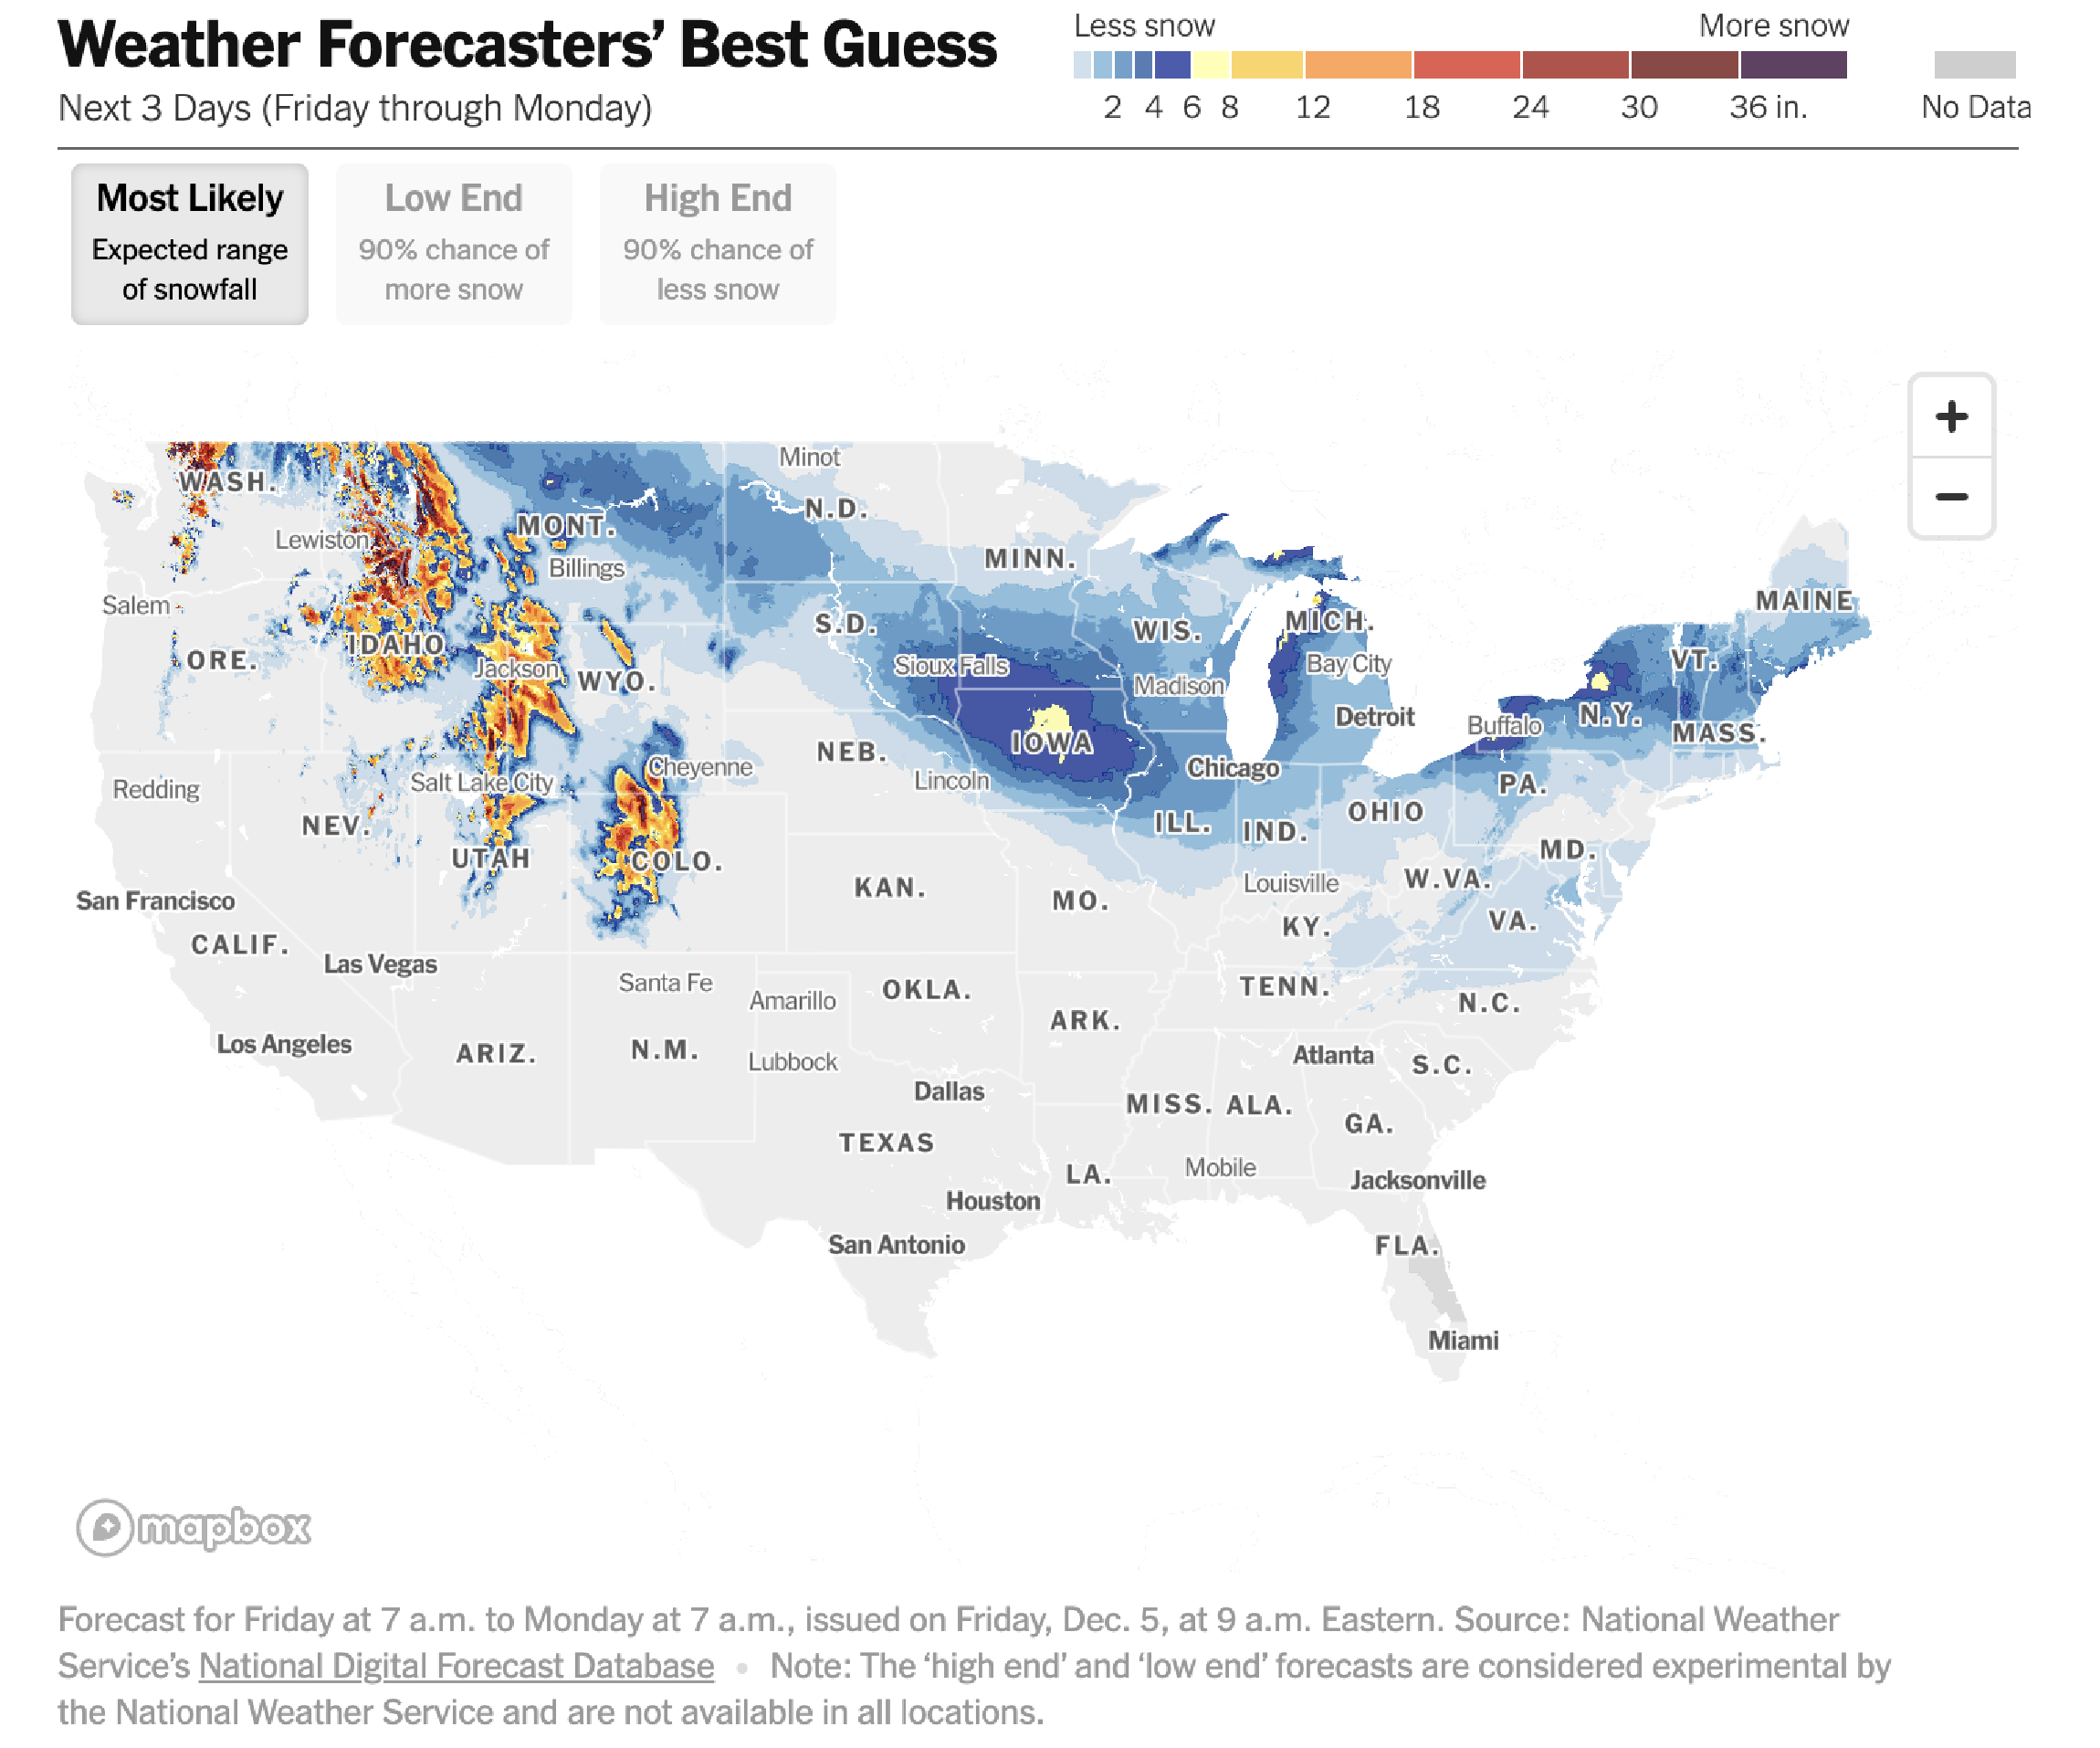
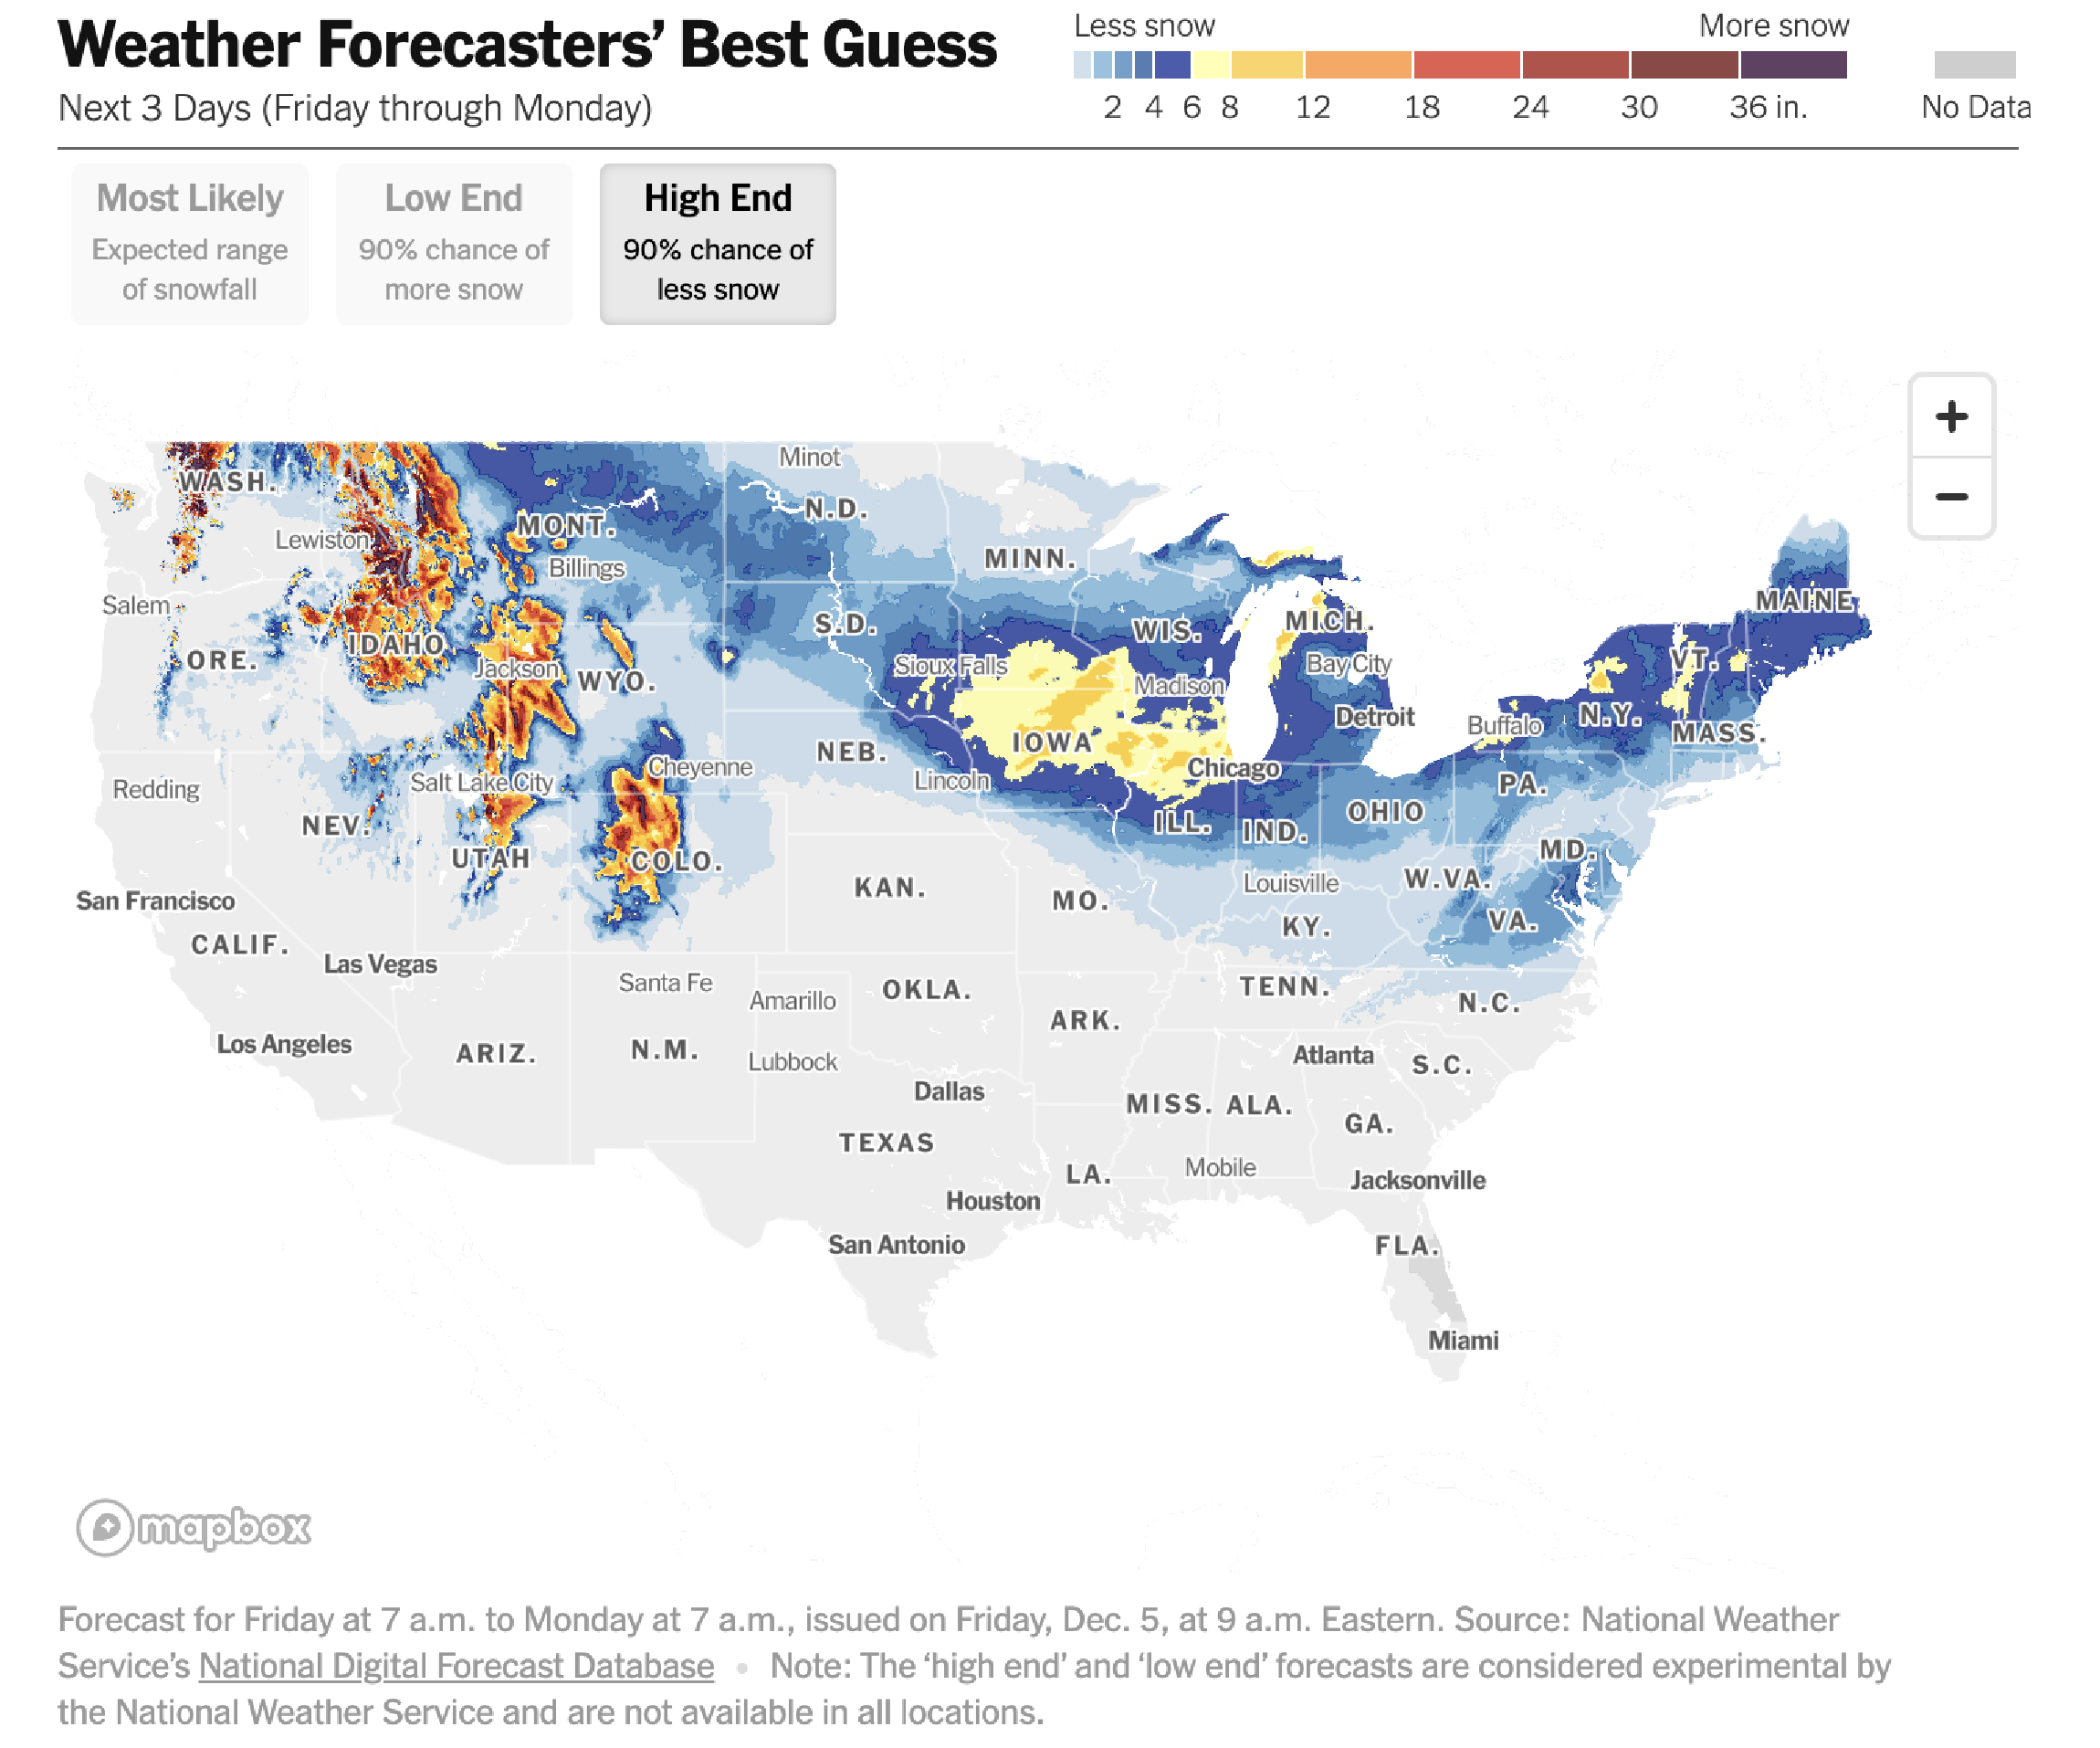
One thing I appreciate about the Times map is that it also includes high- and low-end estimates of snowfall. It's both rigorous and useful: snow enjoyers and snow loathers can each envision their ideal worlds.
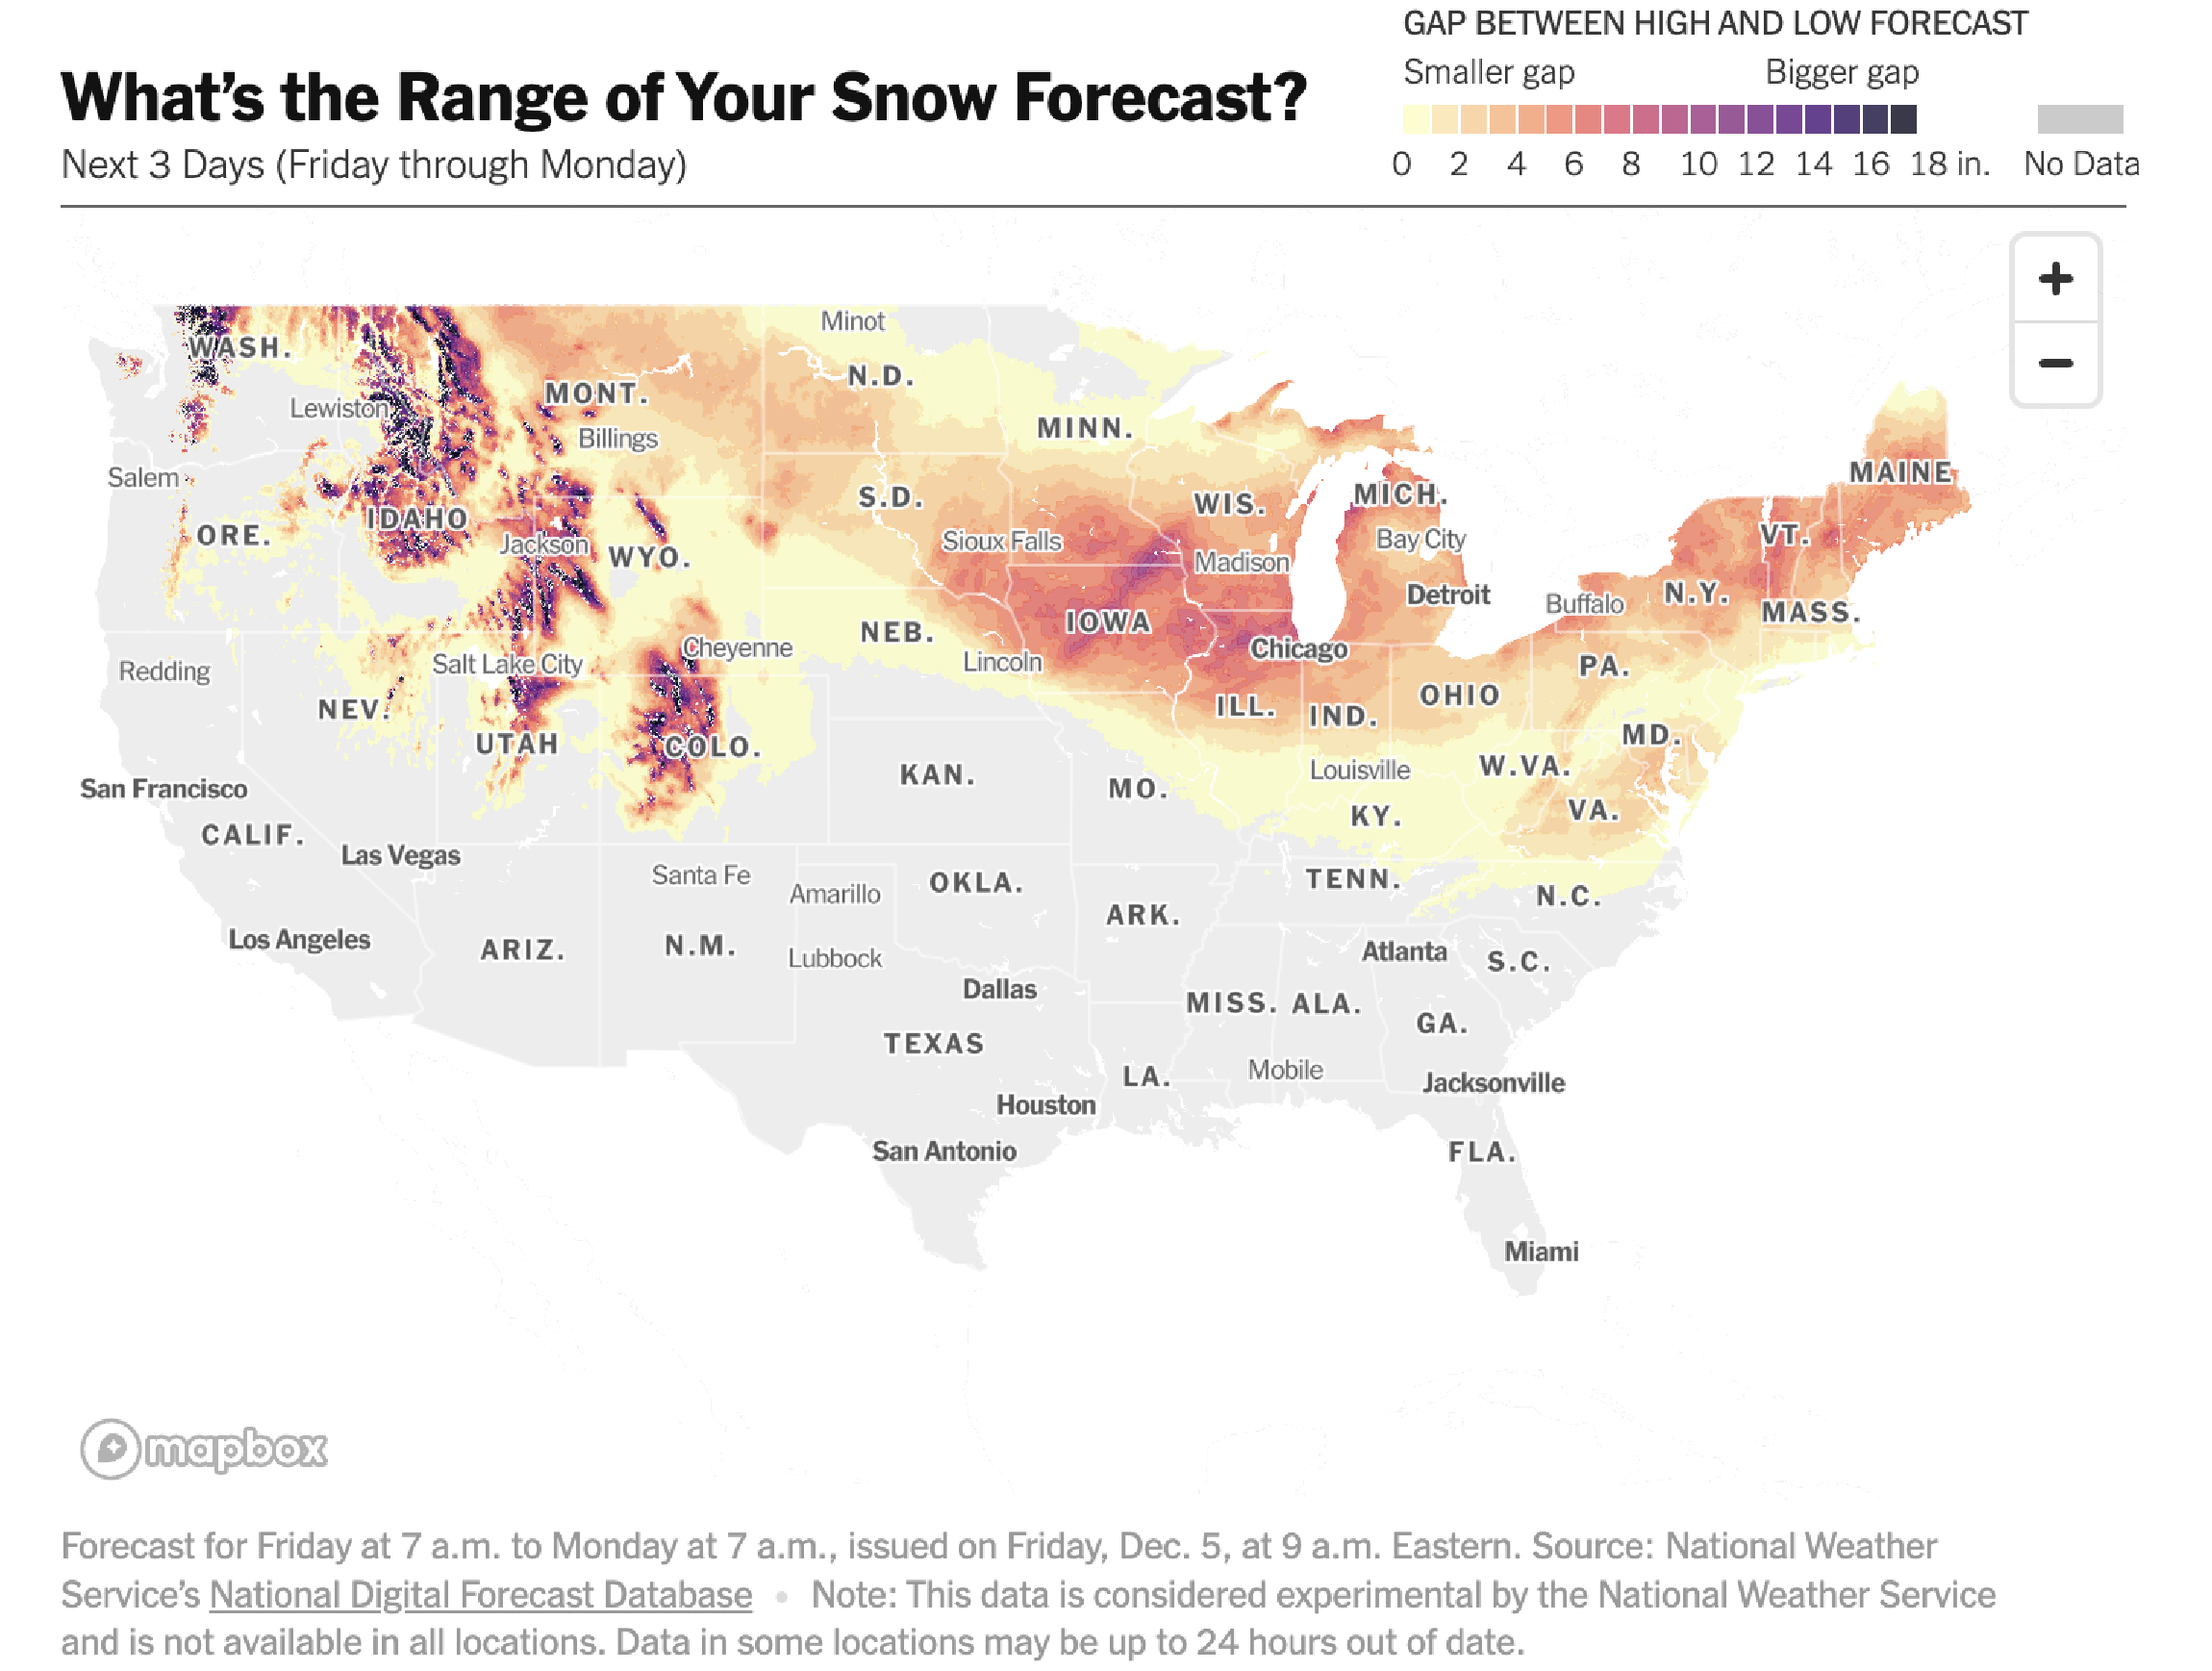
Having an estimate range also allows the Times to present a map of the ranges of expected snowfall — functionally a map of predictive uncertainty. Of course, it is also a map of how wonderfully bonkers snowfall in the Rockies is. Maybe you'll get two inches or maybe you'll get 20. Guess you'll have to wait and see!
I have to also give a shoutout to my alma mater, The Washington Post. The Capital Weather Gang continues to do good work, including documenting D.C.'s first snow of the year this week. Post staffers also make excellent visualizations of their own, like this one showing how miserable the weather has been of late.
Even snow haters will have to admit, though, that it does offer some utility. (That's a segue!) (I like to announce any segues, so that the otherwise smoothish transition it creates becomes a weird, jarring interruption.)
Chapter 3
Putting snow to work
I am admittedly a bit late to the phenomenon of the "sneckdown," maybe one of the worst portmanteaus in the history of the English language.
See, a "neckdown" is a traffic calming measure that extends the curb further into the street near an intersection, preventing cars from parking there and making it easier to see cross traffic. It also can slow traffic, as people naturally go more slowly on narrower roads.
A "sneckdown," then, is a temporary neckdown created by snow. Either because snow has been plowed into banks or because cars haven't driven over it, snow builds up and serves the same function as an intentional, permanent curb adjustment.
What's particularly interesting about sneckdowns (ugh, what a word) is that they organically capture traffic patterns. Snowfall allows us to see where cars drive and where they don't — and therefore to see where roadways might be underused or unnecessary.
A sneckdown data visualization community has emerged. The animation below, for example, shows where traffic flows through a square and how the square could be redesigned to accommodate that flow while returning space to pedestrians and bicycles.
Another example, showing both space reclamation and safety improvements.
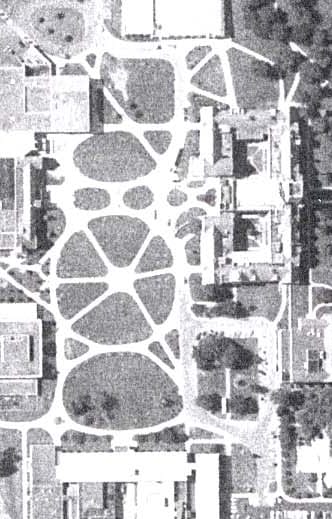
The benefits of tracking movement through snow isn't limited to vehicular traffic, of course. When a major blizzard blanketed the Midwest in 1978, geography students at the University of Toledo used the opportunity to photograph and document the paths students took between buildings. The result was a map of desire paths that were then formalized into walkways through the central mall on campus.
Those of you who live in non-snowy places don't have to be left out of the fun. A similar phenomenon emerges during autumn when the ground and streets are covered with leaves. (I regret to inform you that this is called a "leckdown.") A few years ago, a neighborhood used leaf patterns to draw their own revisions to a local intersection.
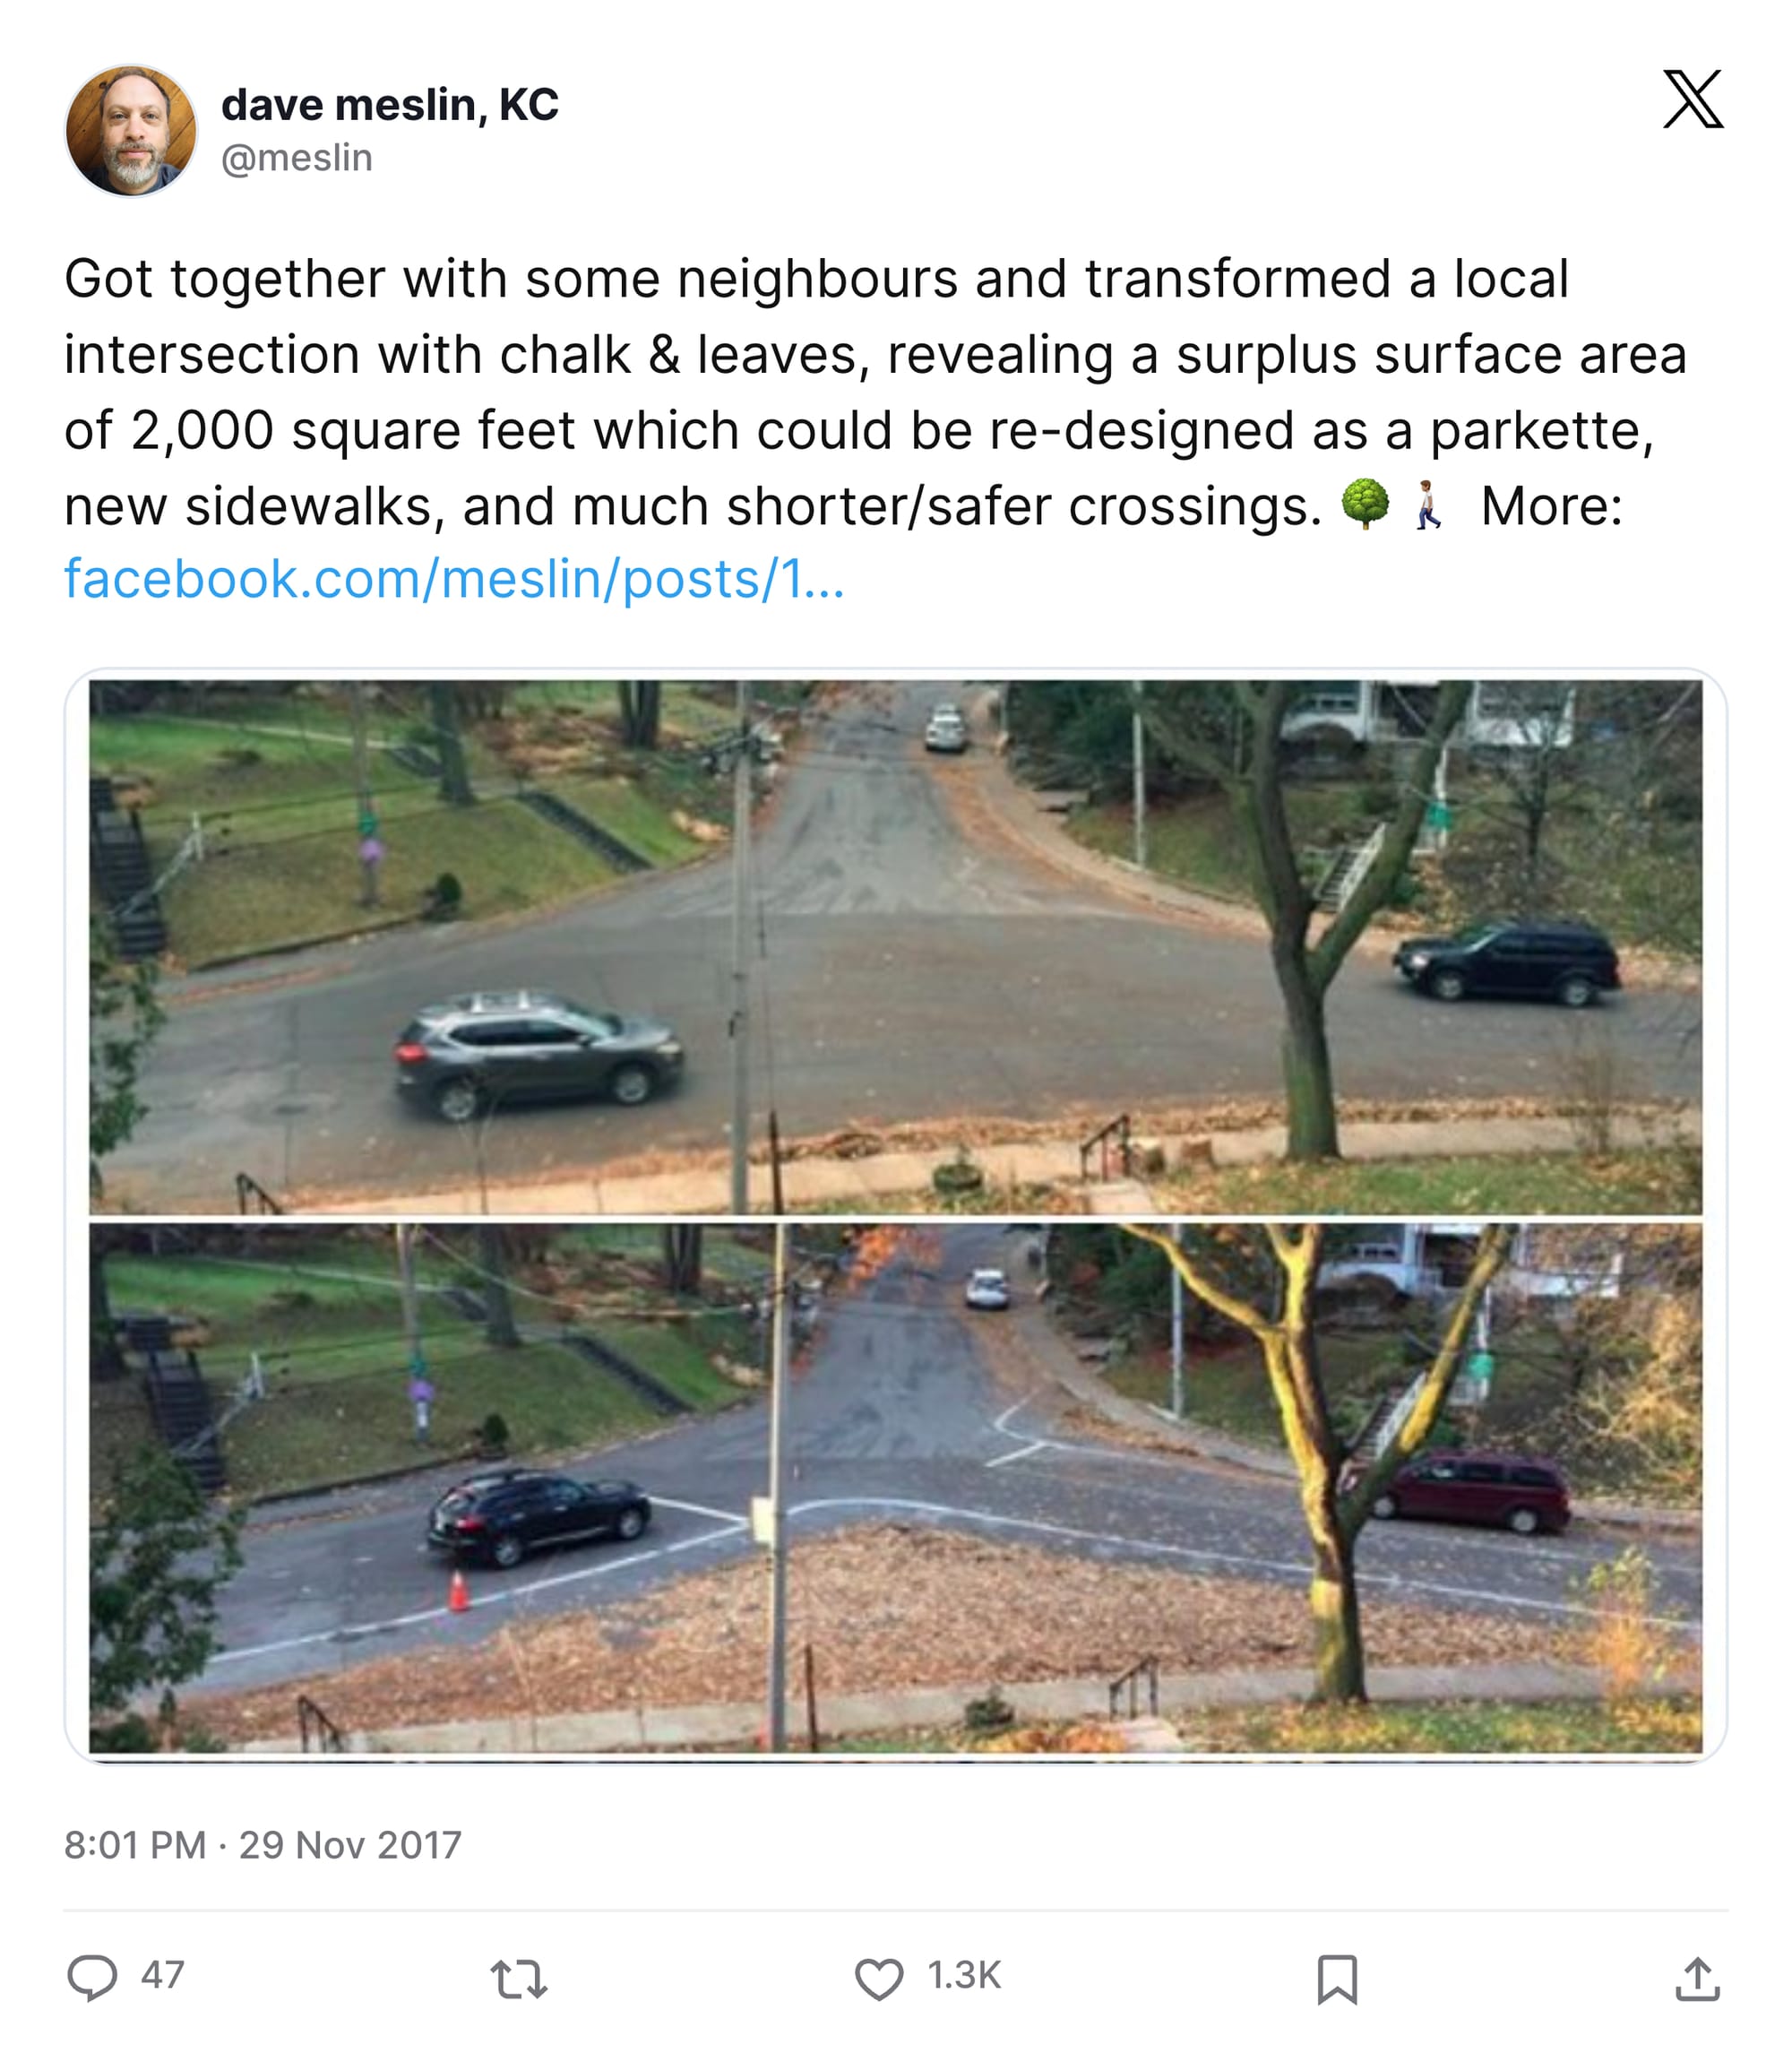
Not quite as elegant as the snowy iteration, but still functional. And since the future of snow is uncertain, worth keeping in mind.
(That's another segue.)
Chapter 4
Snow: Fun while it lasted
If there is any silver lining to climate change — besides, say, somehow literally lining clouds with silver in order to reflect sunlight away from the Earth — it's that we have plenty of data showing how the phenomenon has emerged.
Some of the best visualizations of that emergence come from climate scientist Zack Labe. Labe first started studying climate change in the Arctic while he was in graduate school. He quickly realized that what he was observing was important for everyone to understand, not just scientists.
"The Arctic is warming more than three times faster than the global average," he explained in an email this week. "That rapid warming is tied to other sudden shifts, including the loss of sea ice, melting on the Greenland Ice Sheet, and thawing permafrost, all of which affect ecosystems and communities across the region."
"Given how fast these changes are unfolding," he explained, "I felt it was important to communicate the data more openly and accessibly through platforms like social media."
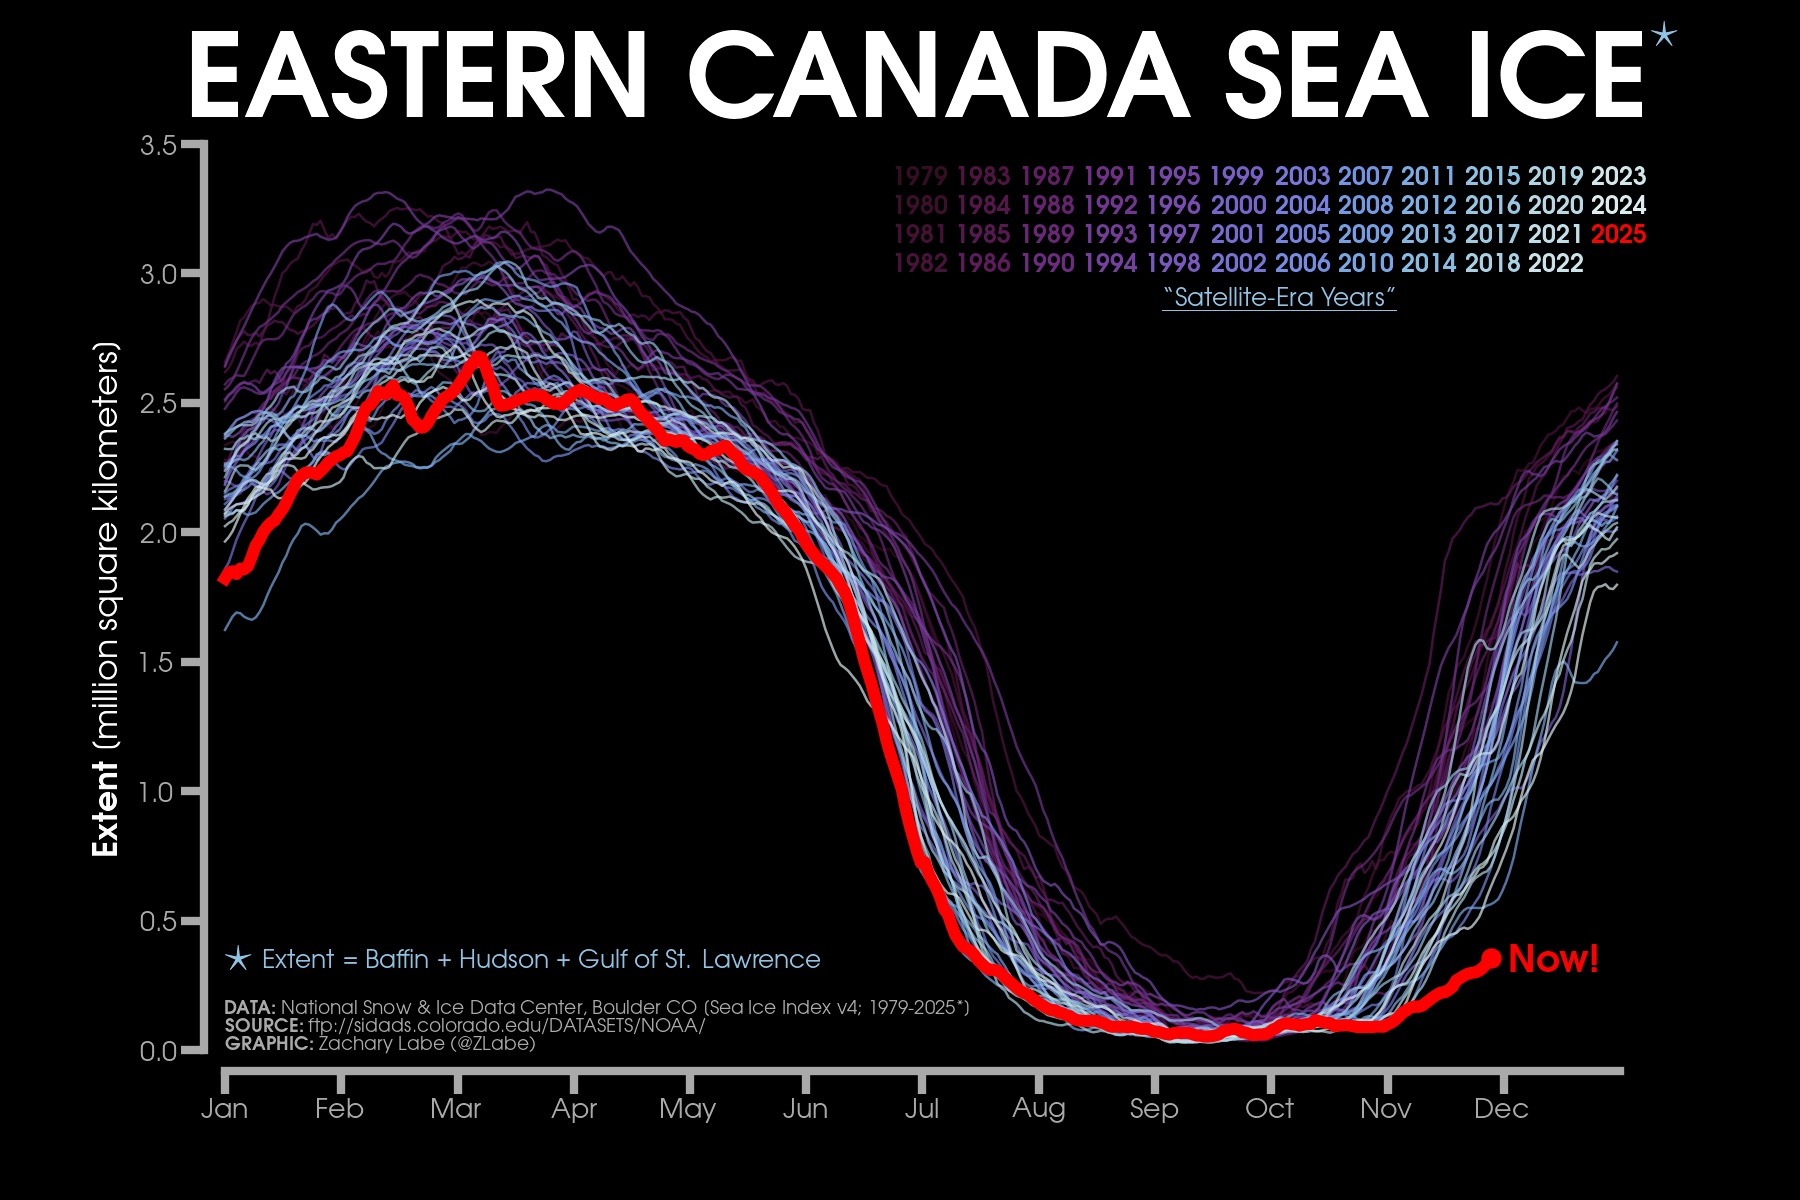
Now, he creates regularly updated visualizations of how the Arctic is changing. His recent charts showing the decrease of Arctic sea ice, for example, generated a lot of traffic on social media specifically because they illustrate how exceptional the moment is.
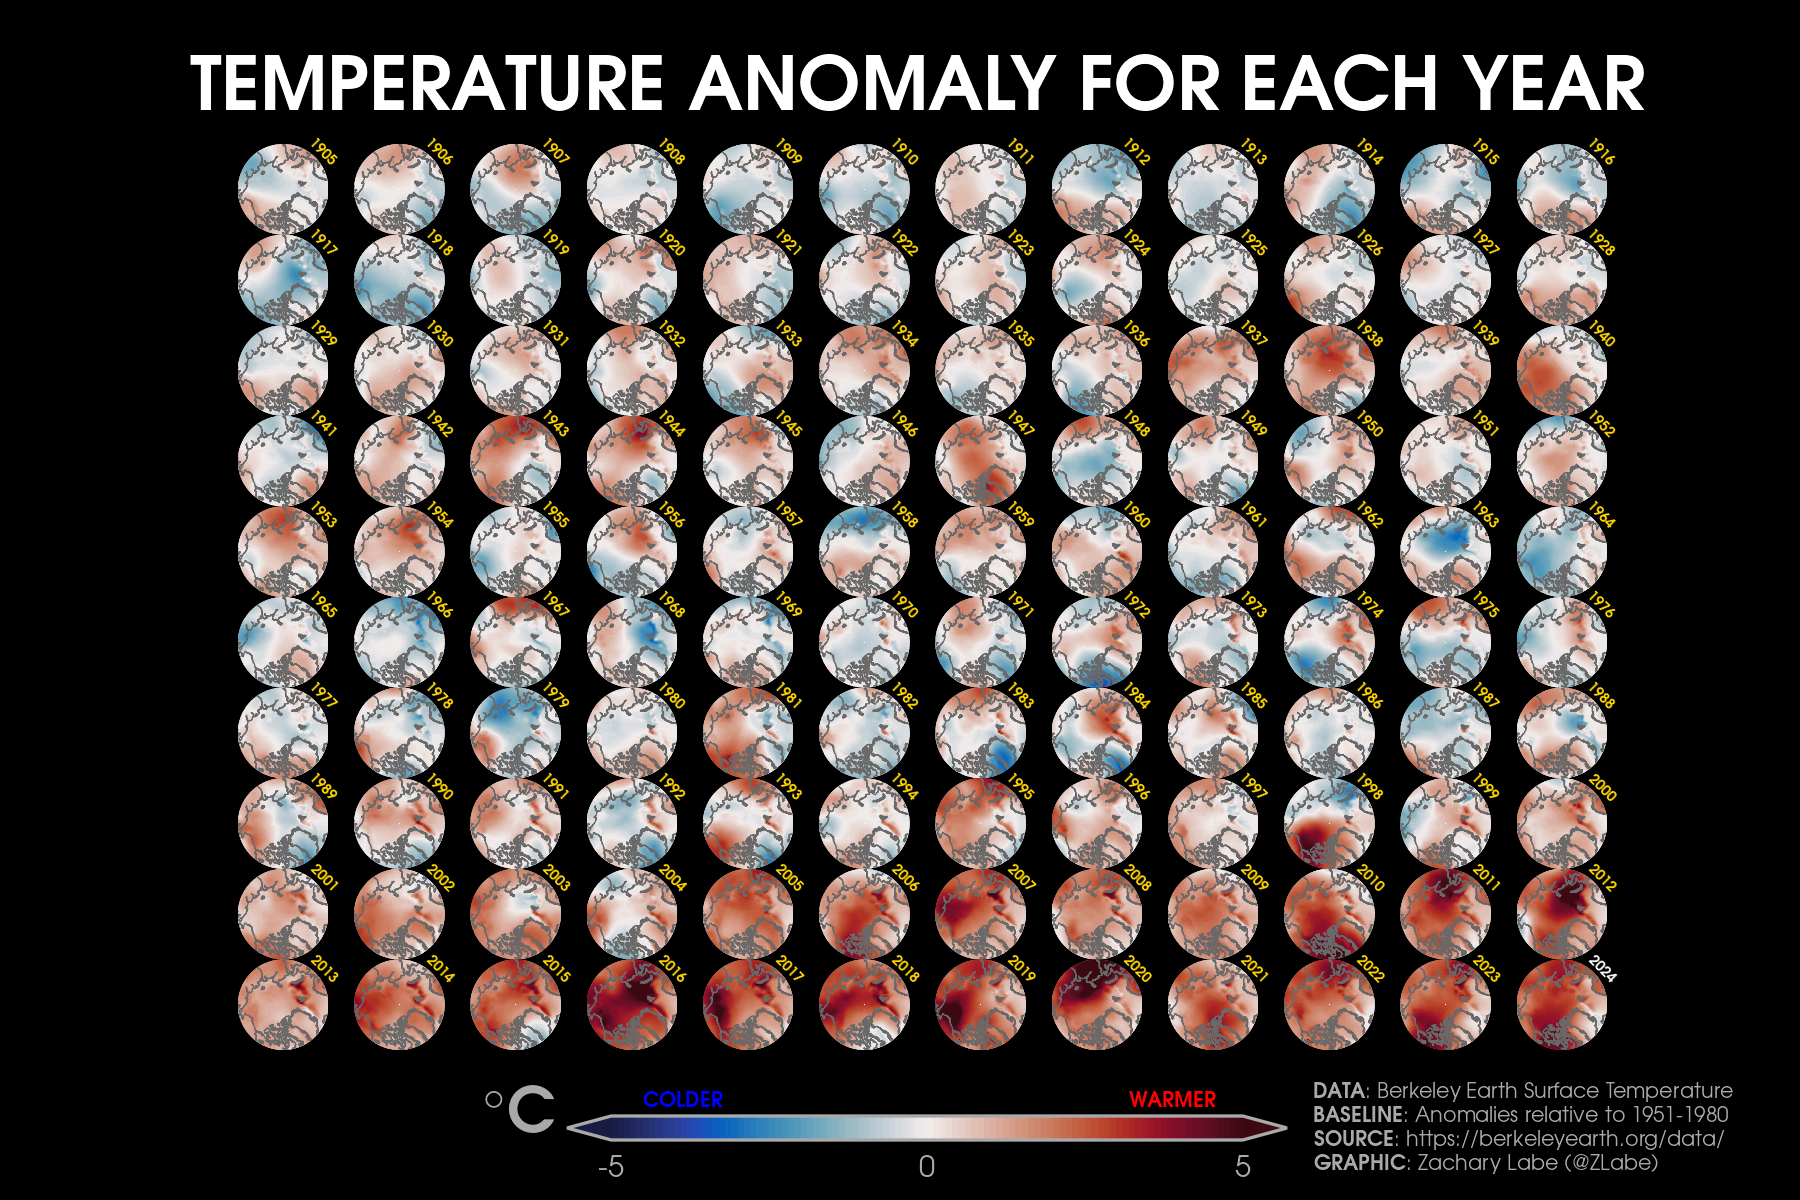
The visualization he likes best, though, is the one below. It shows the monthly deviation from 19th century temperatures over the past 170 years.
"As you scan left to right," he wrote, "the long-term shift is obvious as the colors move from blues into deep reds. Earth is warming. I also mark the warmest months with an extra red dot to highlight that the hottest periods have all occurred in just the last few years."
"The big picture is immediately clear," he continued, "but it also invites anyone to dig in to the data and explore the nuances of how our planet is changing."
This is the mark of a particularly good visualization: If one's instinct is to spend more time on it, picking out interesting exceptions. Like 1877-1878 on the chart above, which became known as the "year without a winter."
Which — to bring things full circle — sounds pretty miserable to me.
Chapter 5
Chart Attack
Now, at long last, we move away from snow and back toward what you want from this newsletter: random visualizations that are generally centered on documenting the collapse of society.
We begin with one of the most remarkable examples thereof. According to 404 Media, someone altered a map of front lines in the Ukraine-Russia war in order to win a bet on Polymarket.
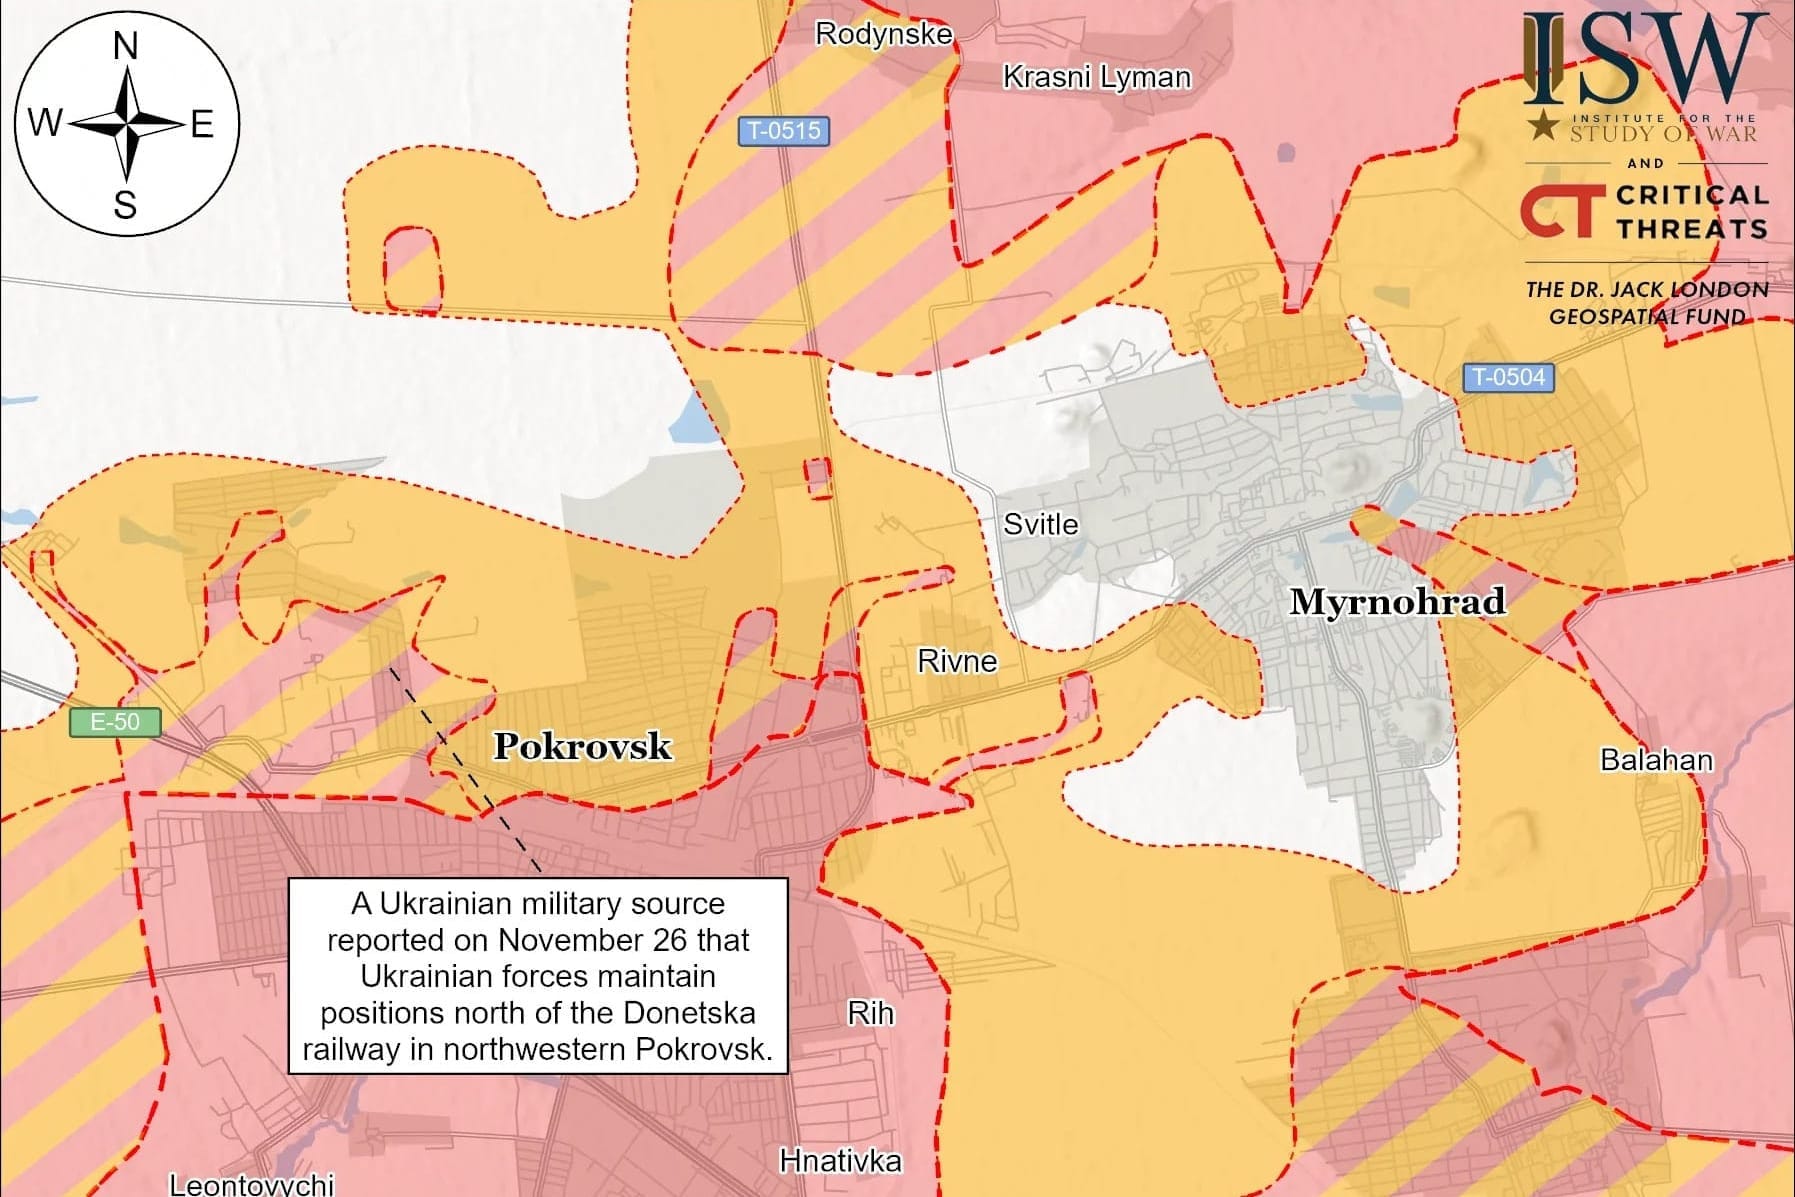
In other words, there were a number of wagers about where those lines would sit on a given day and, when the day arrived, the map that served as the official measure of those lines was apparently changed to alter the outcome of the bet. What I particularly appreciate about this story is that "betting on a war" is only its second-most ethically dubious element.
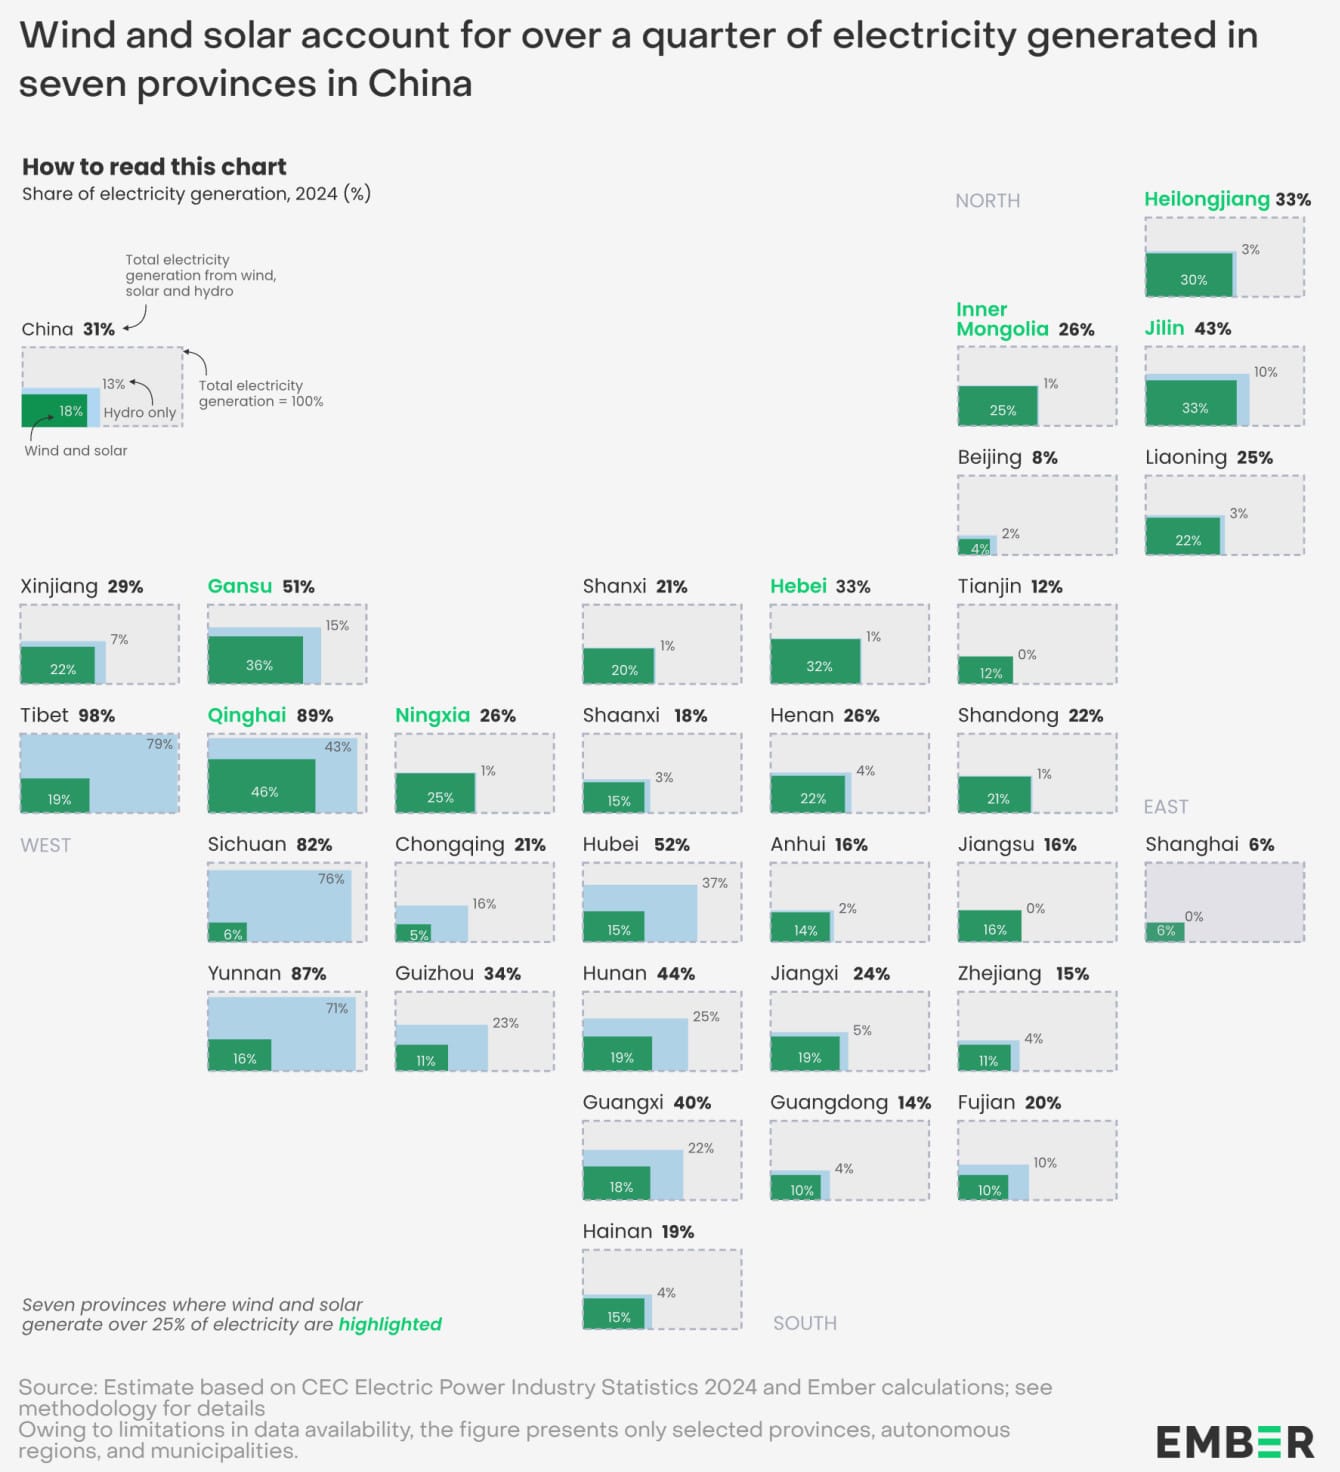
Returning briefly to climate change, there is some good news from the world's second-most populous country. It has deployed an awful lot of renewable energy.
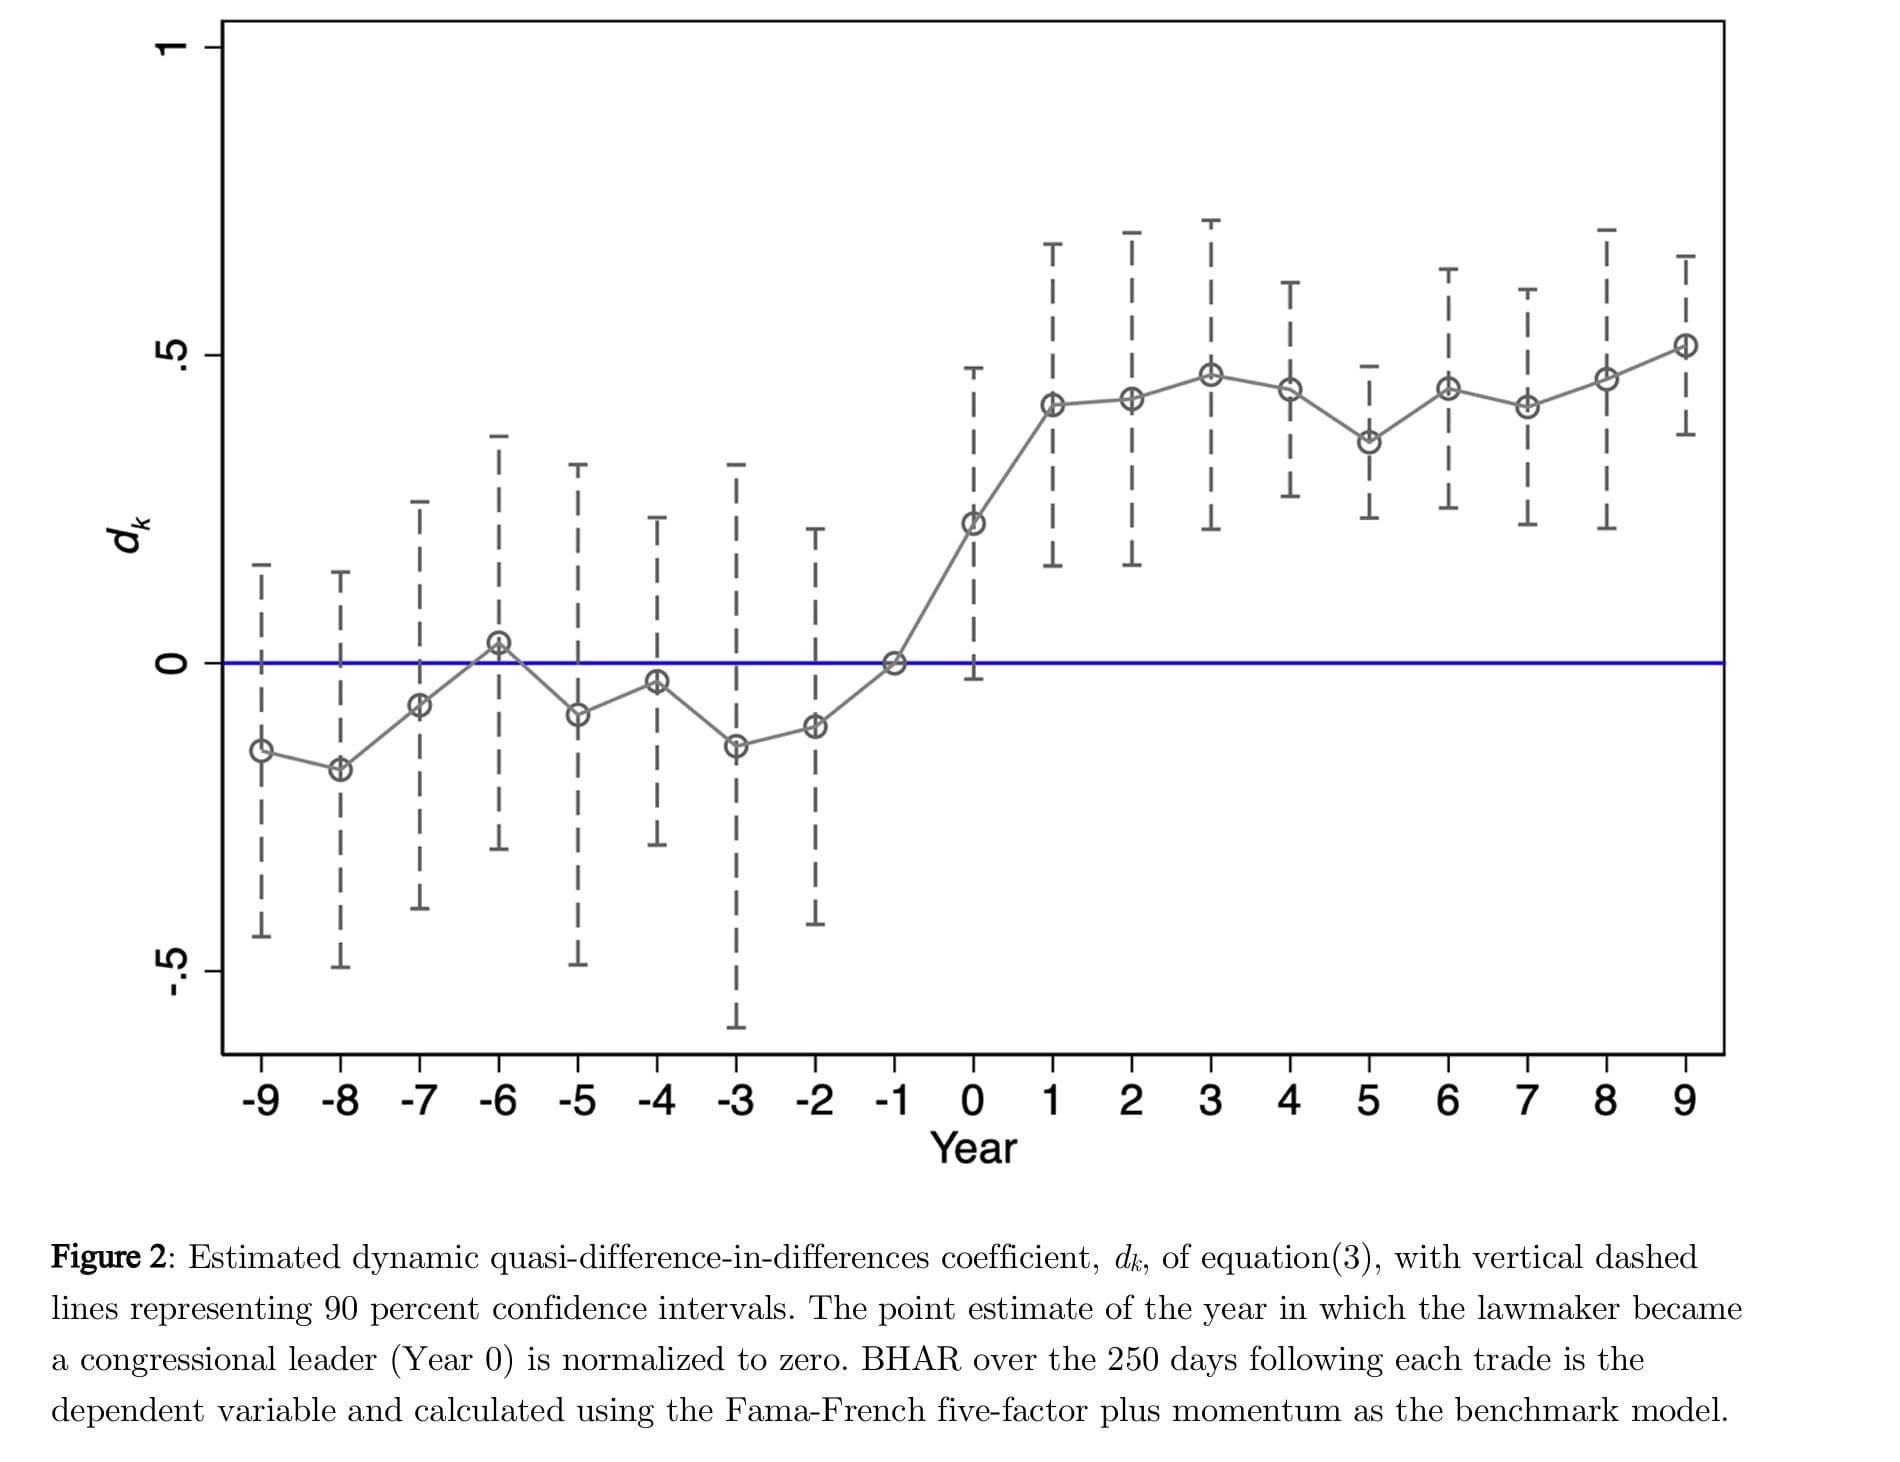
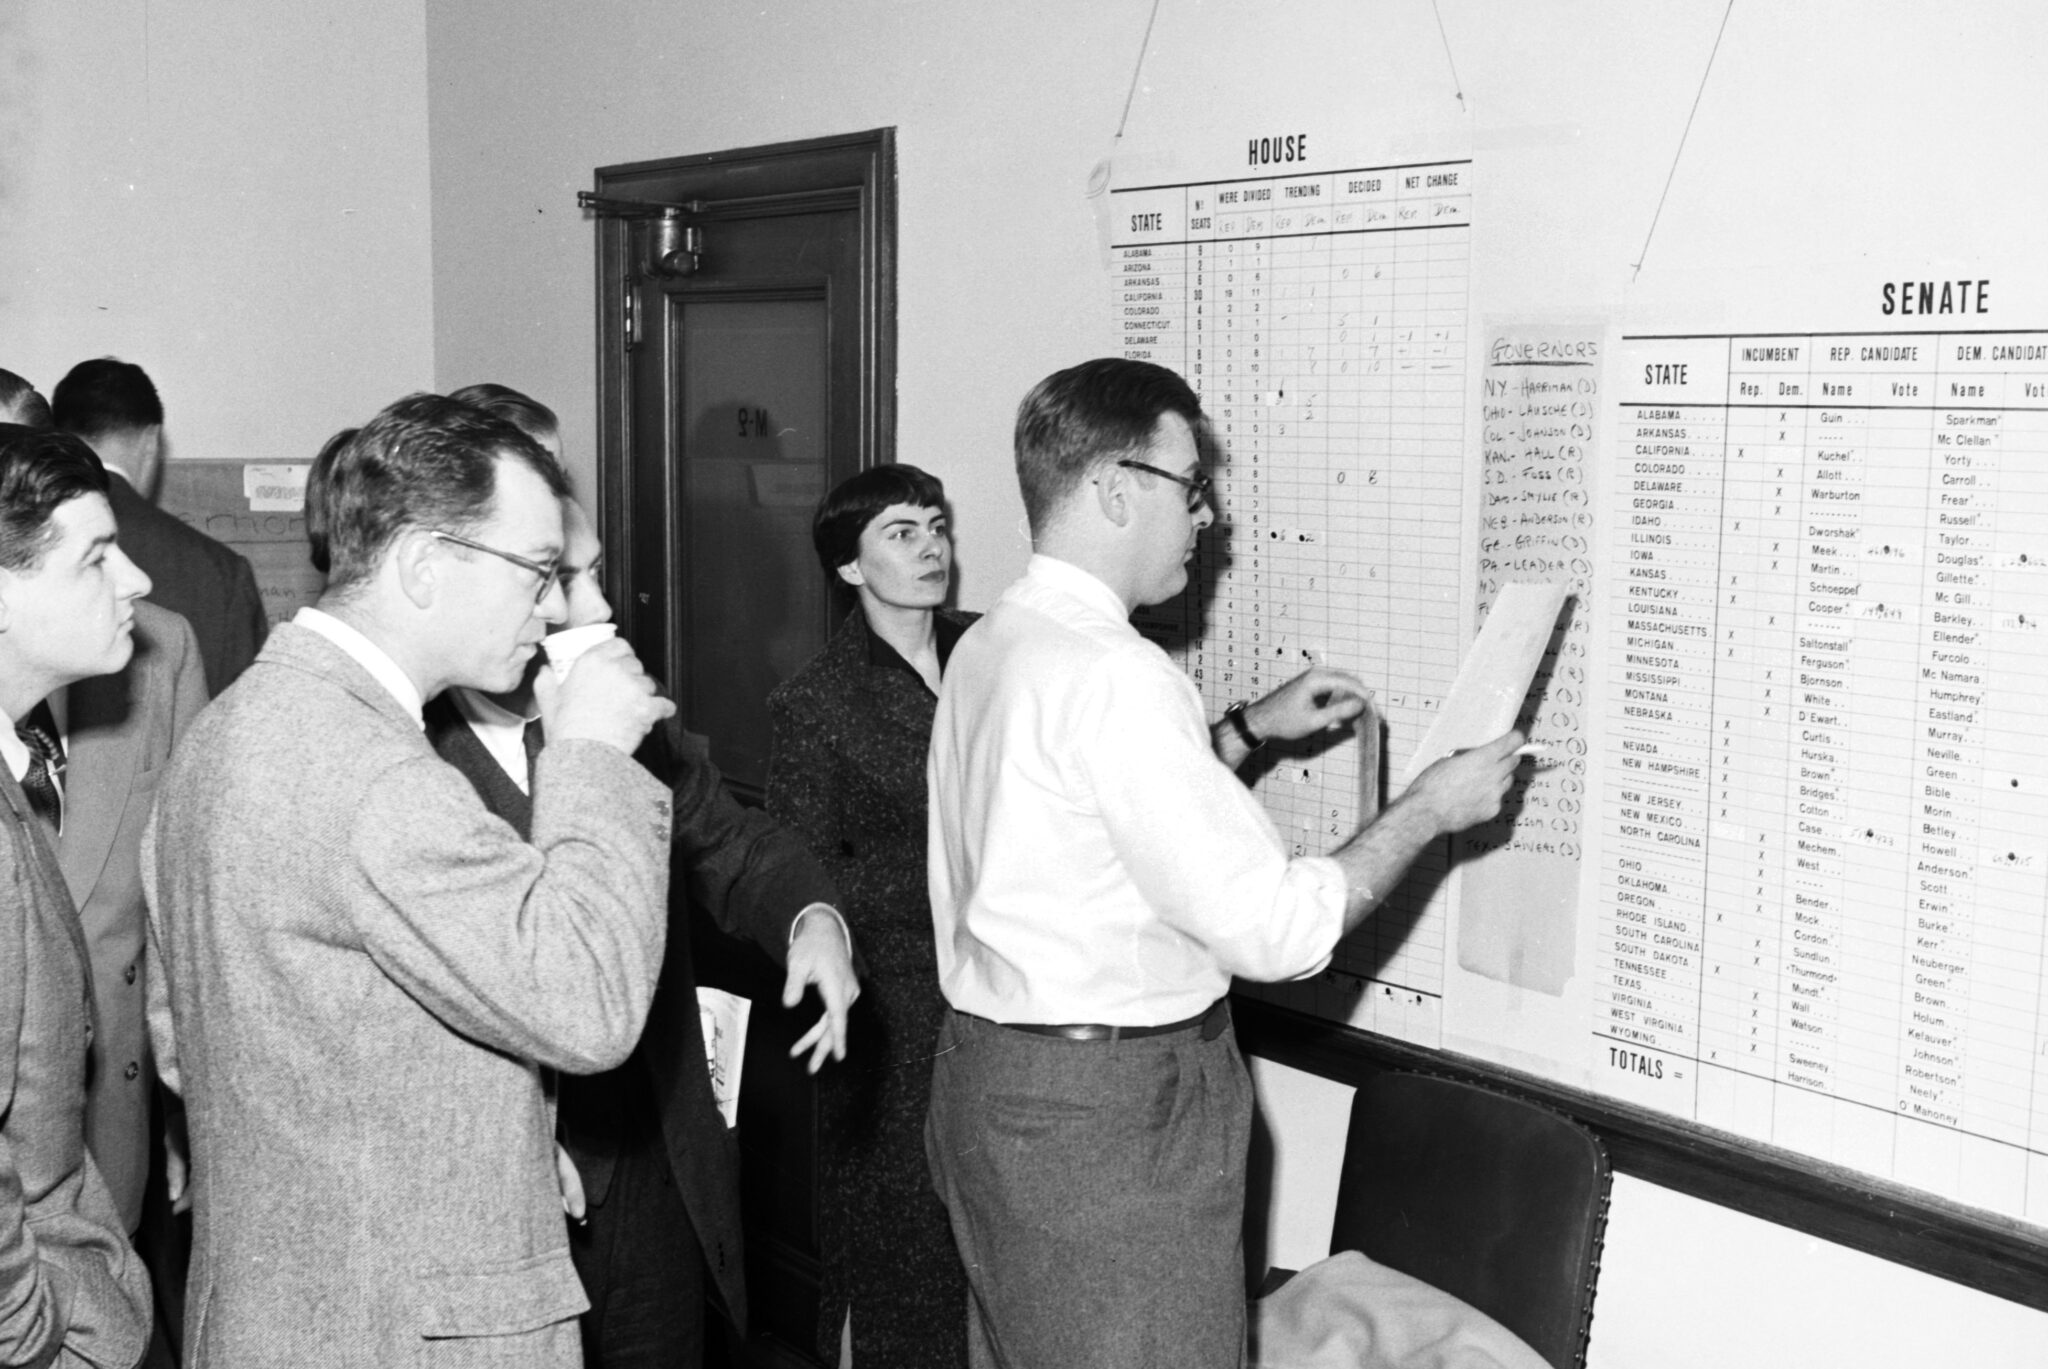
Back at home, newly published research shows that once a legislator rises to a leadership position in Congress, he or she suddenly starts doing a lot better in the stock market.
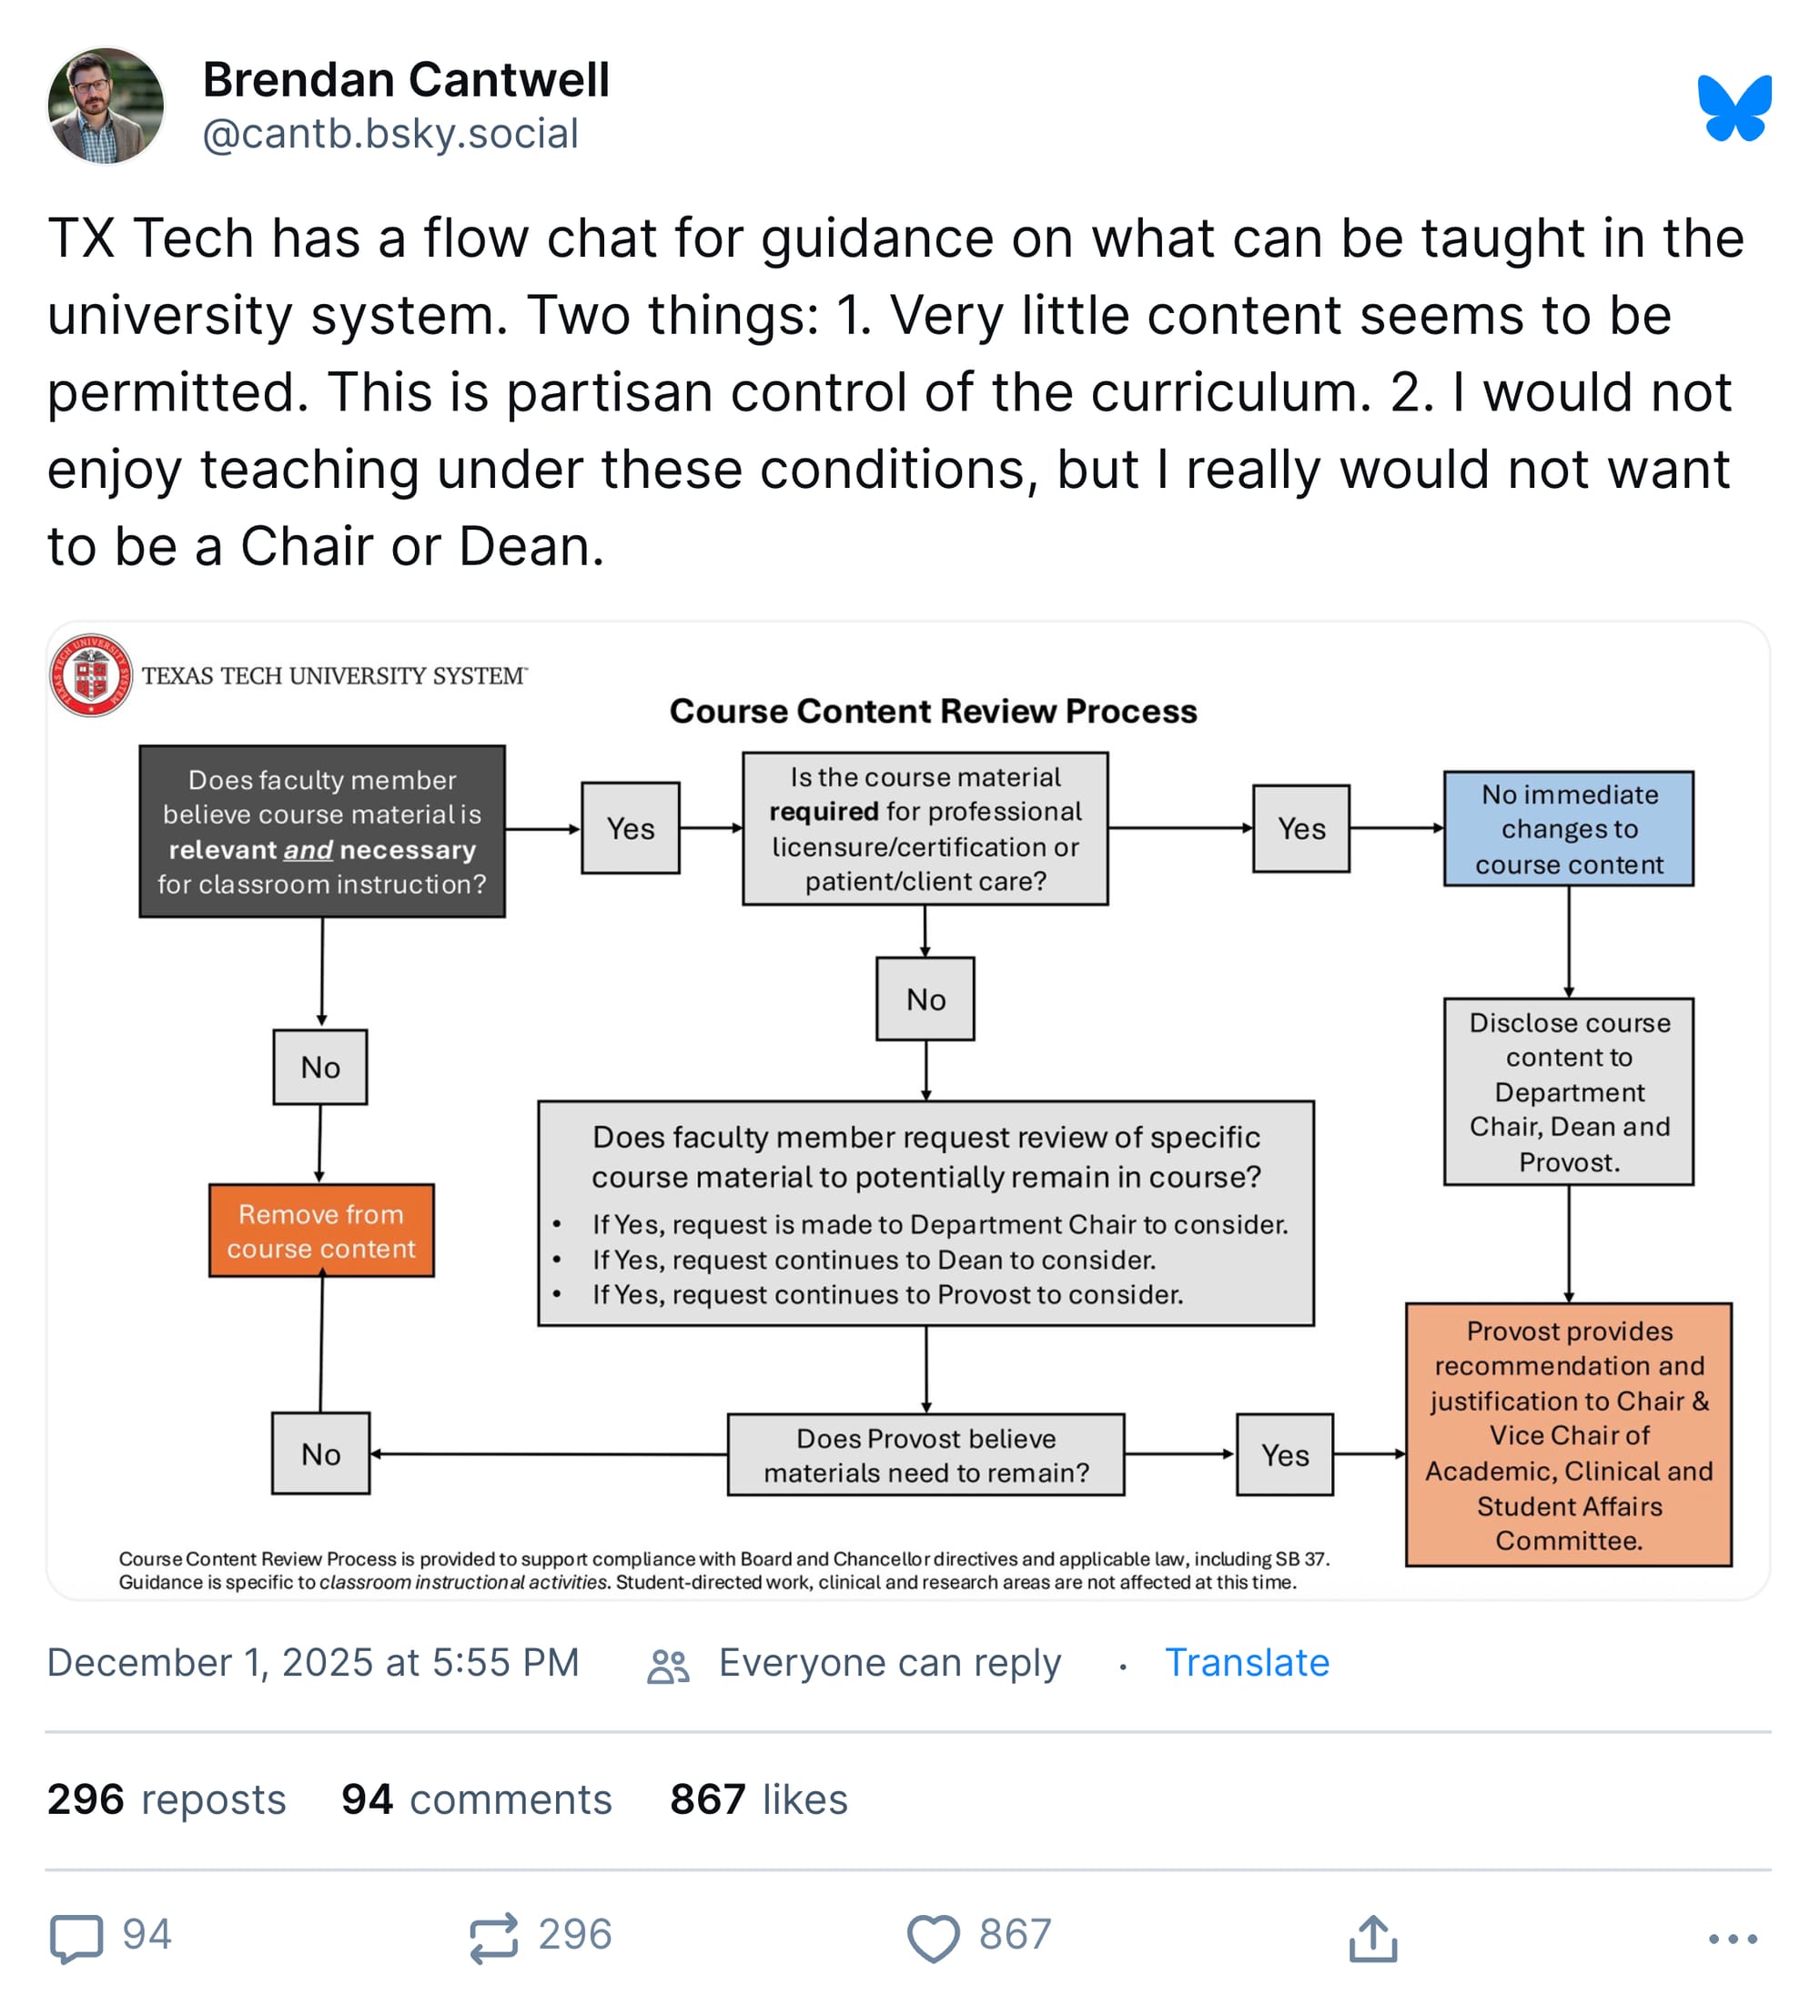
Texas Tech, meanwhile, has created a flowchart by which it seeks to ensure that professors aren't engaged in wrongthink.
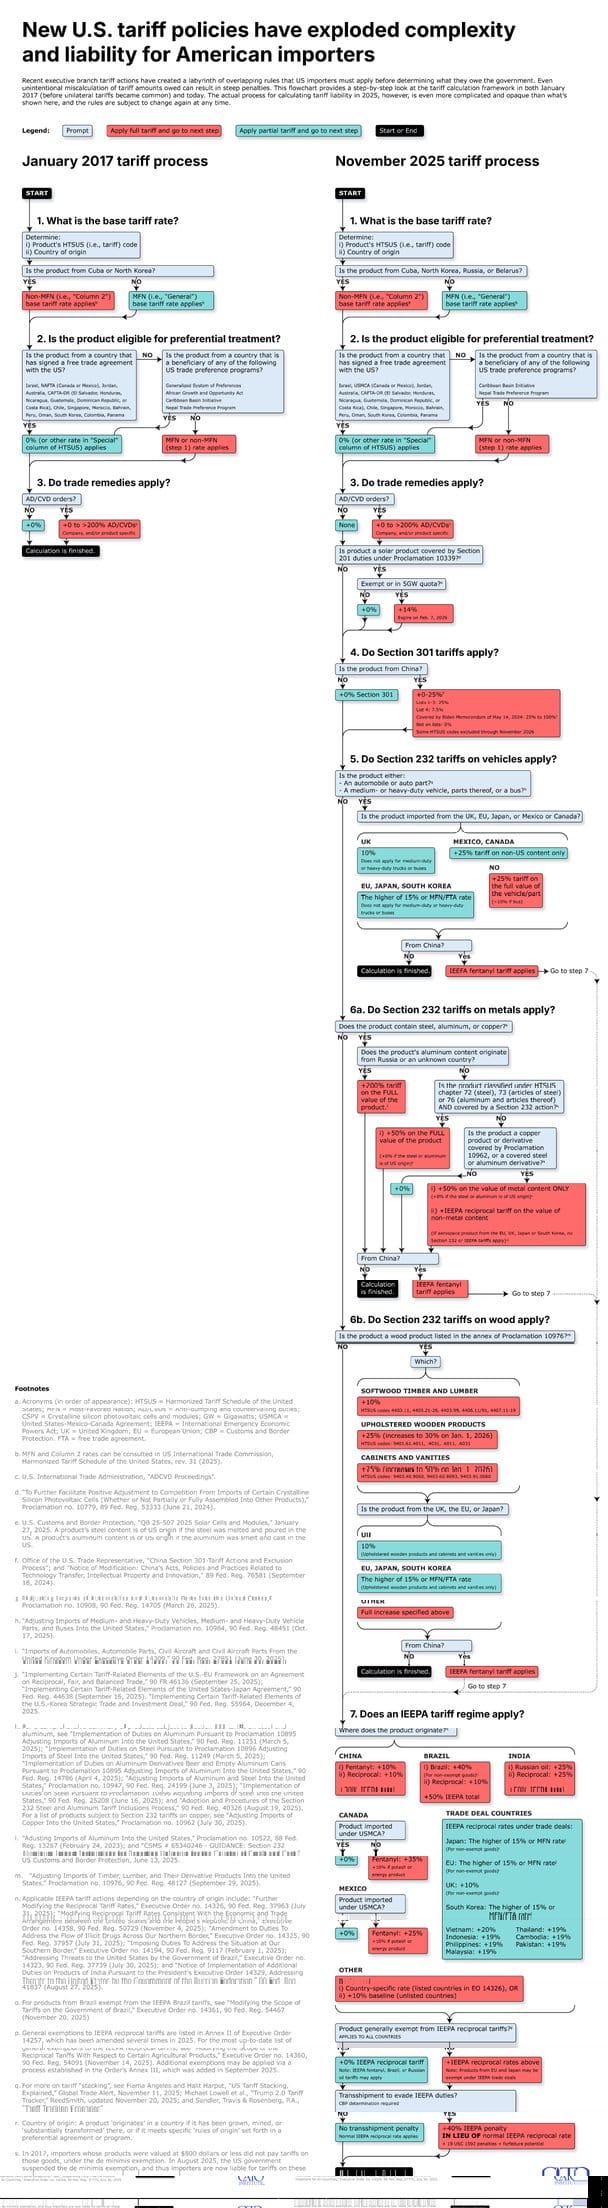
Another flowchart, created by The Dispatch, explains at a glance how much more cumbersome tariffs have become since President Trump began using them as a foreign-policy tool.
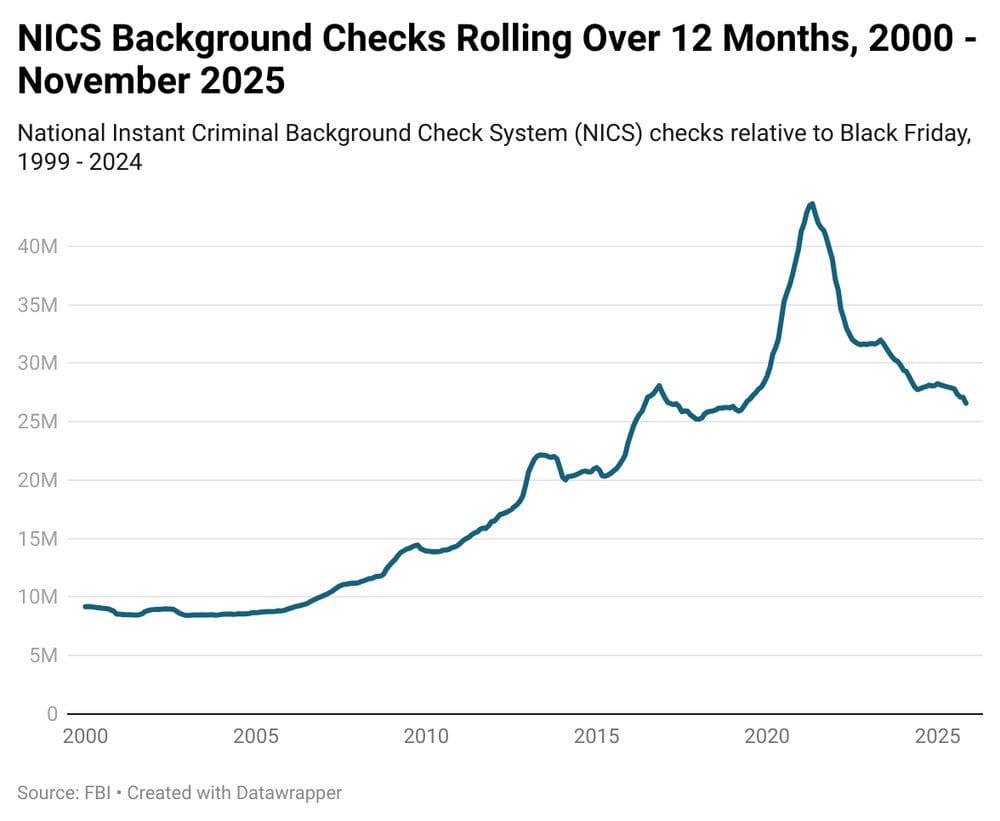
There is at least one trend that the political left will find somewhat comforting, though. The number of gun background checks has been sliding for the past four years, suggesting that fewer firearms are being purchased.
Anyway. Enough politics by data viz proxy. Let's end by looking at Radio Garden, an interactive map that lets you find — and listen to! — radio stations around the globe.
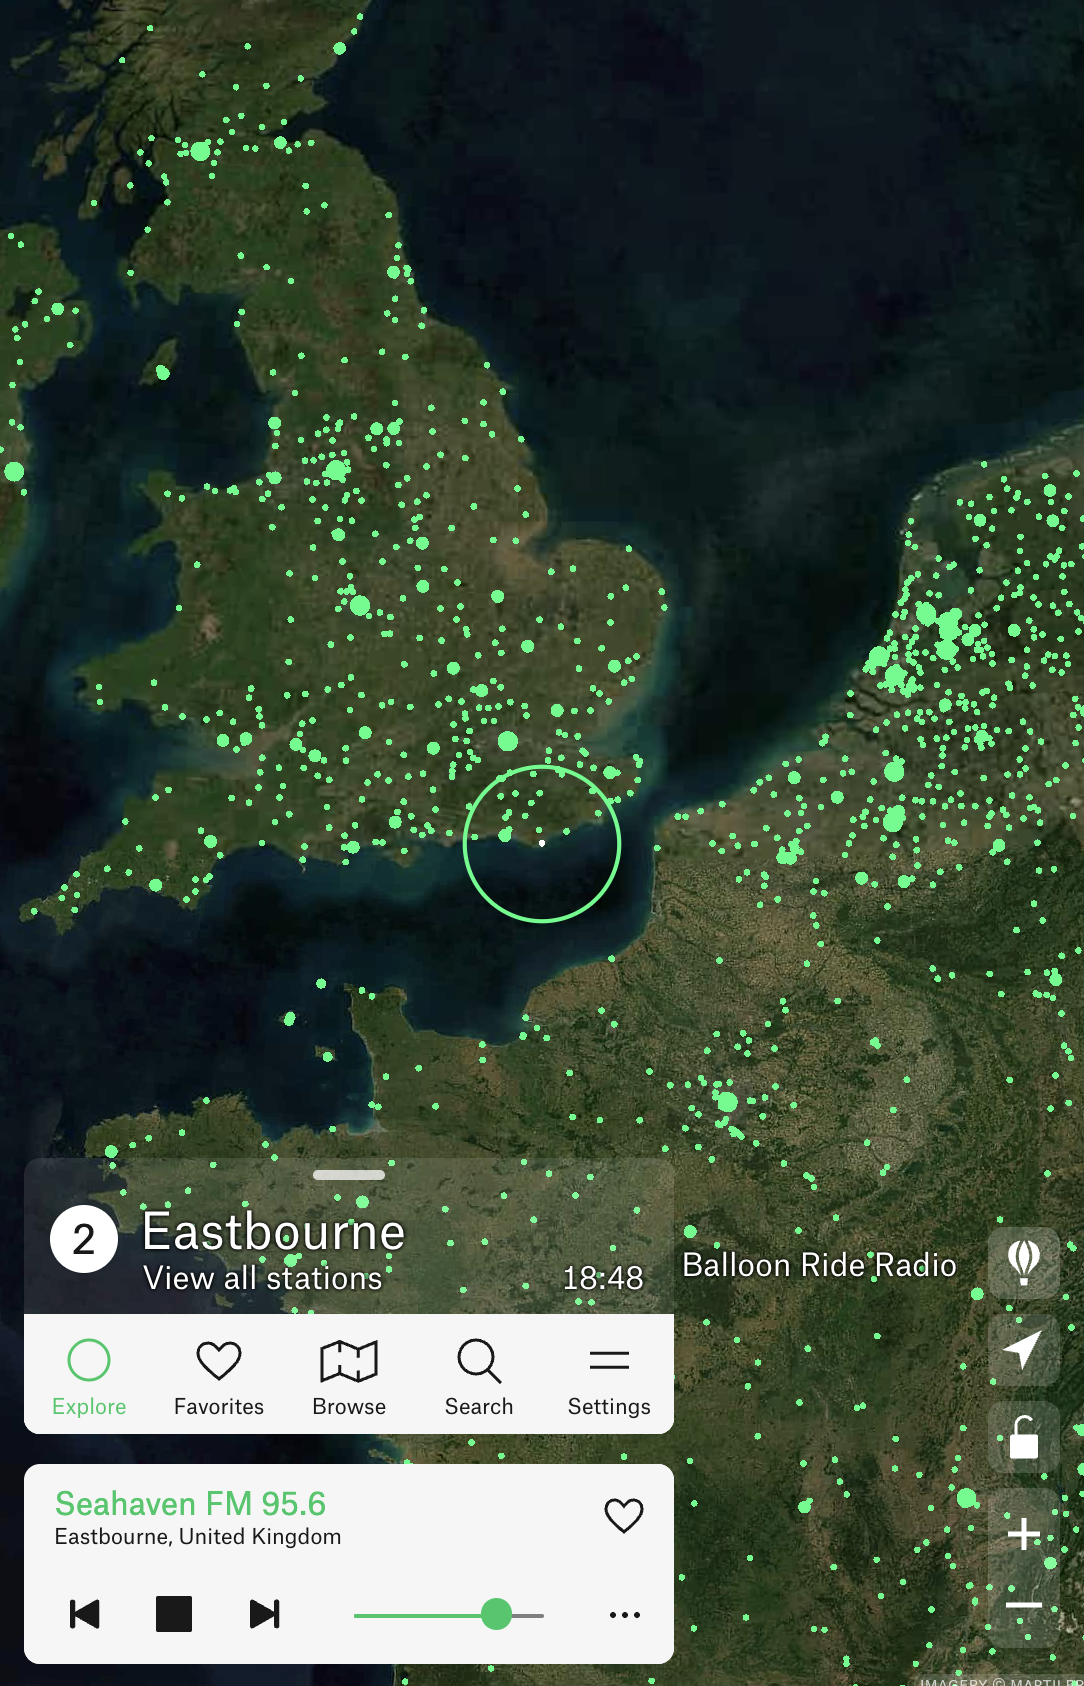
In order to take the screenshot above, I zoomed over to the U.K. and clicked a station at random. When I tuned in — and this is true — it was playing "White Christmas."
Here's hoping.
Appendix
Some other things I've written


You are receiving this email because you at some point in time volunteered to, either at Ghost or Substack or pbump.net or pbump.com. If you don't want to receive future emails, you're as cuddly as a cactus and as charming as an eel. What you really want to do is support the newsletter financially, right?
Another one is coming next week. You have been warned.