May your love be plotted logarithmically

Today, Feb. 14, commemorates the day St. Valentine drove the incels from Italy or something. It is to love what Oct. 31 is to fear, which makes it a bit nicer in theory but – in practice? Turns out earning candy by dressing up as something dead is more fun than just being given it because people love you.
There's a lesson in there, I suppose. But anyway today I wrote about love, mostly! Some scary stuff too, though.
Chapter 1
What love looks like in America
One thing that I love is YouGov. It is a platonic love, but an earnest one, predictable in that I enjoy numbers and polling and YouGov offers those things in spades. If you are curious about how Americans view something, the odds are good that YouGov has already polled them on it.
(I also love my wife, for the record, even though she conducts hardly any polls.)
When I was curious about the nature of Americans' relationships, I went and checked YouGov. And, sure enough, they had numbers.
Most American adults this Valentine's Day (or at least during the Jan. 29 – Feb. 1 period that the poll was in the field) are in serious relationships. Only about 40 percent of American adults aren't in a relationship, while more than a third are married and another fifth are in serious relationships and/or living with partners.
I couldn't help but wonder if there were partisan differences here, because this is one special, wonderful way in which my brain is broken. And the answer is not really but kind of, which is generally the answer for everything.
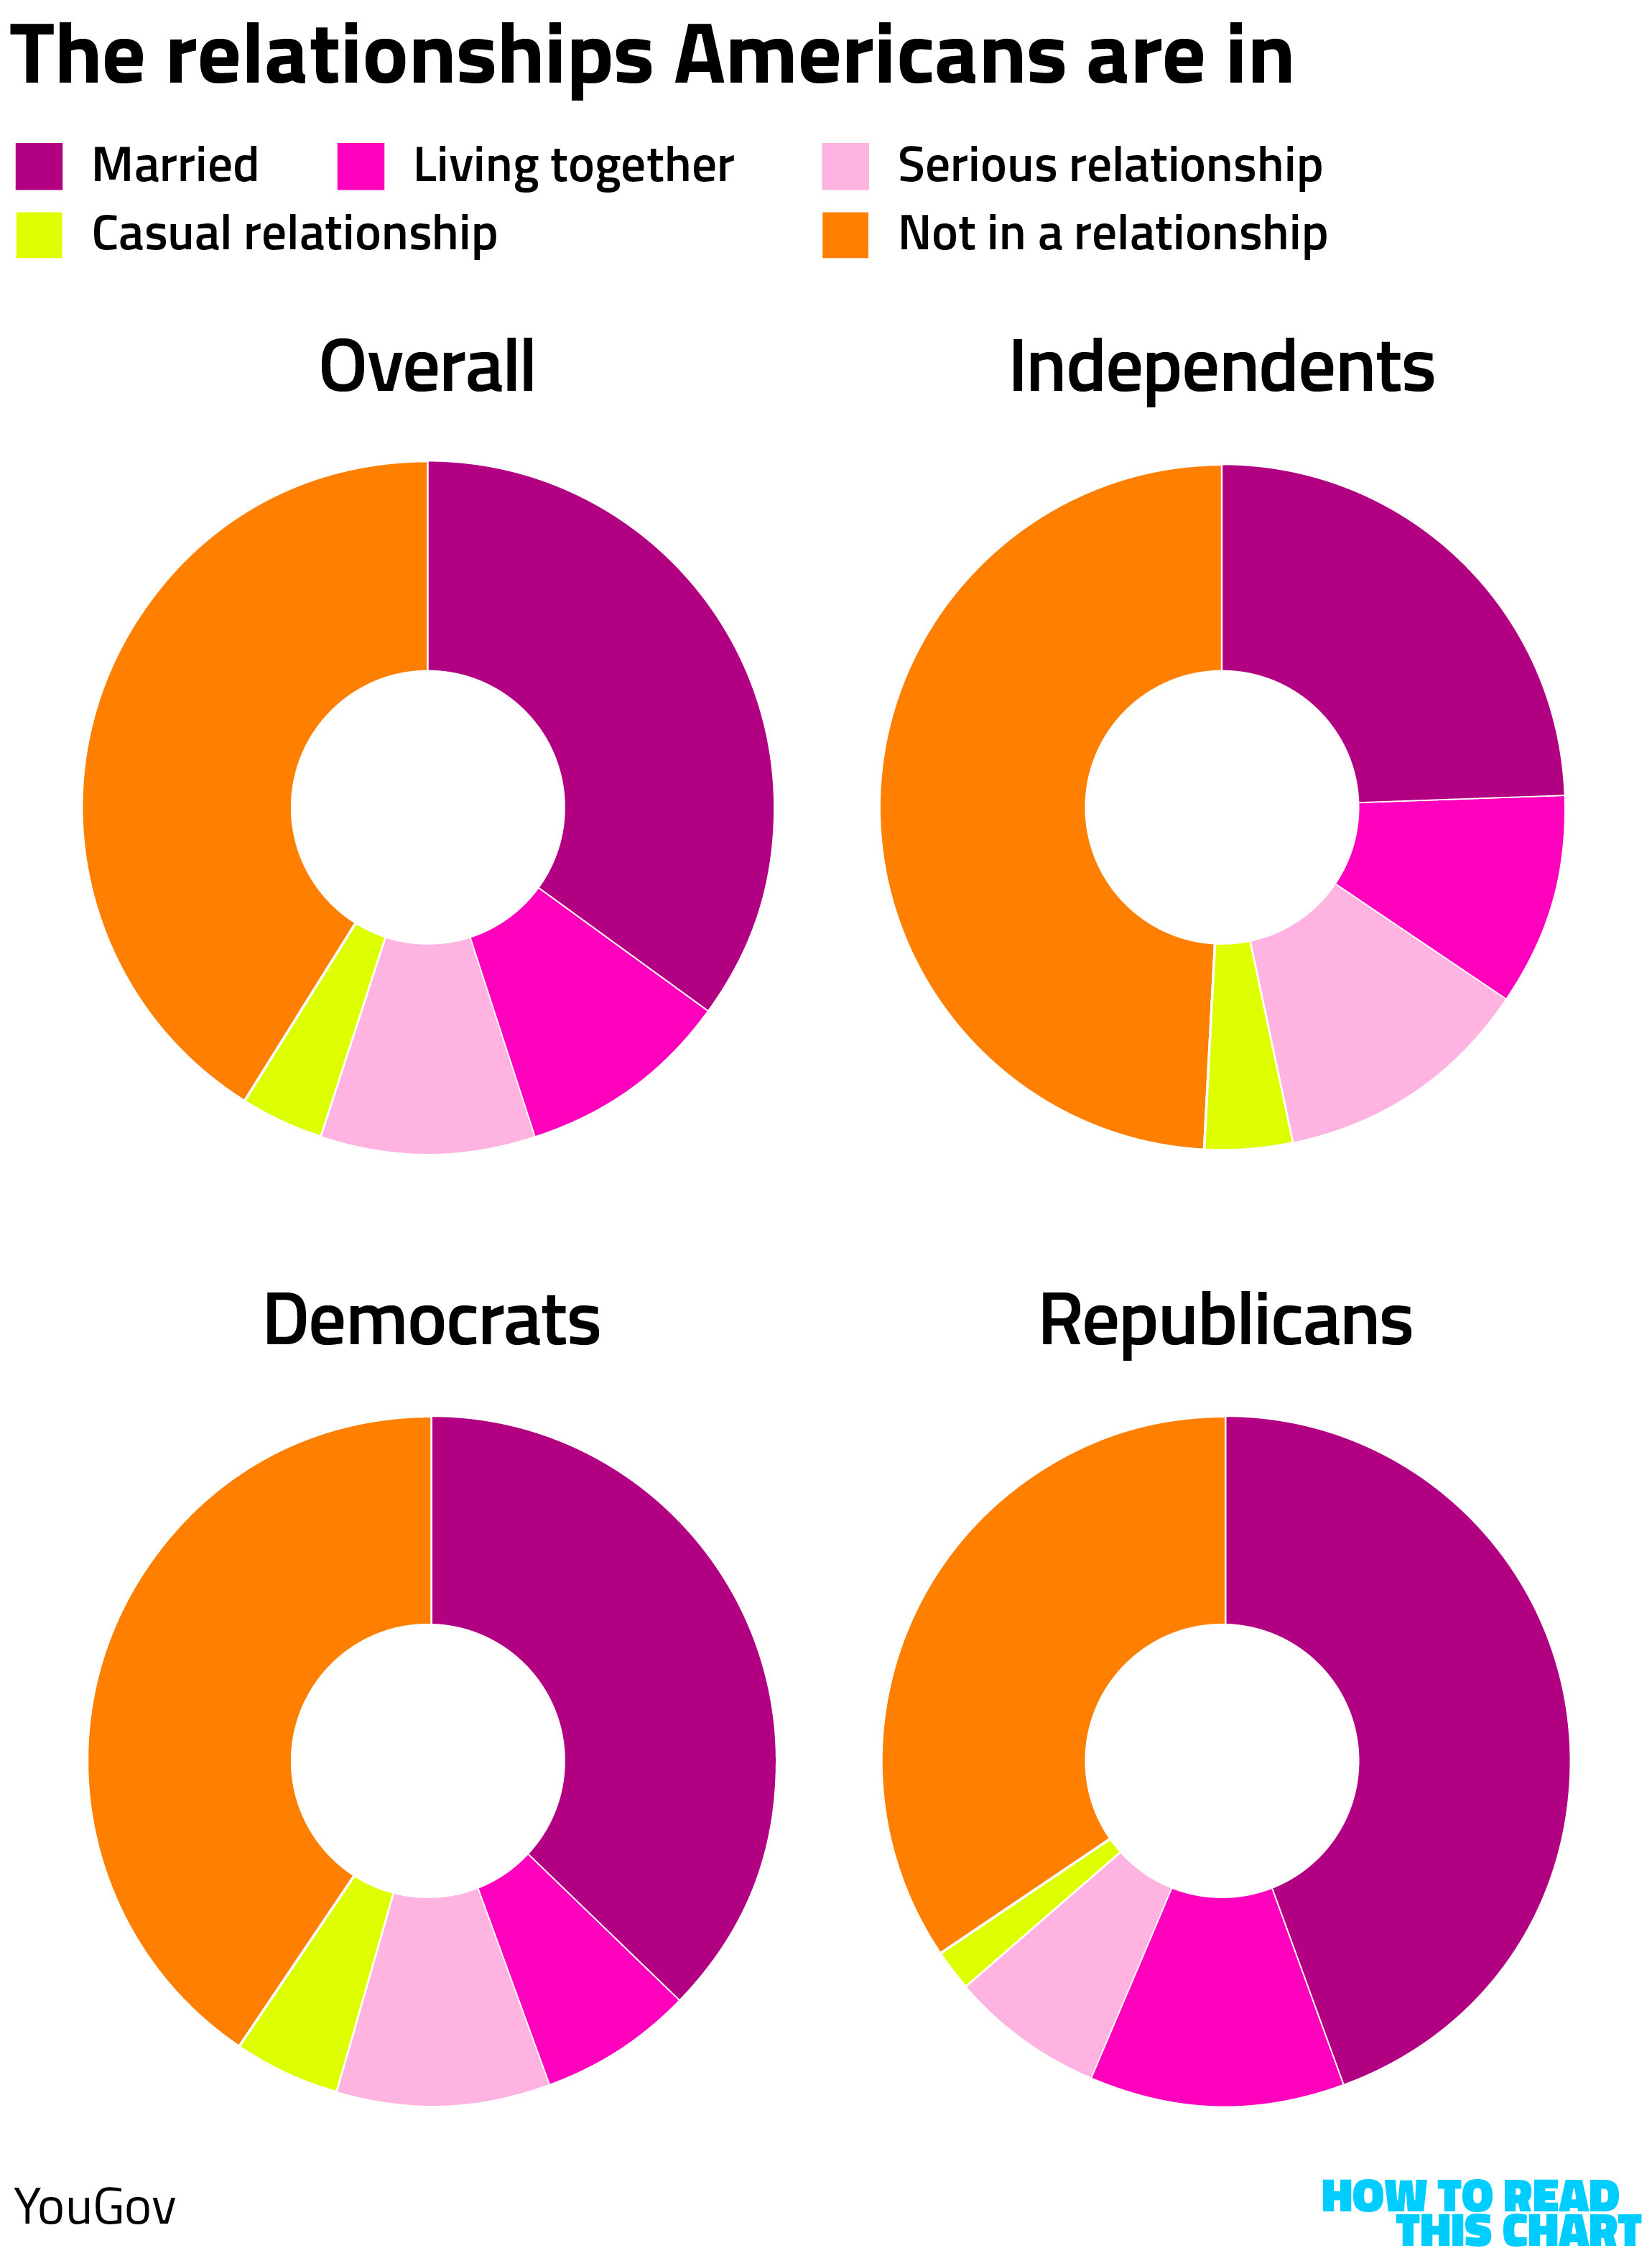
Independents are less likely to be in relationships, as befits the term. (This is probably in part because they skew younger.) Republicans are more likely to be married. (This is probably in part because they skew older.)
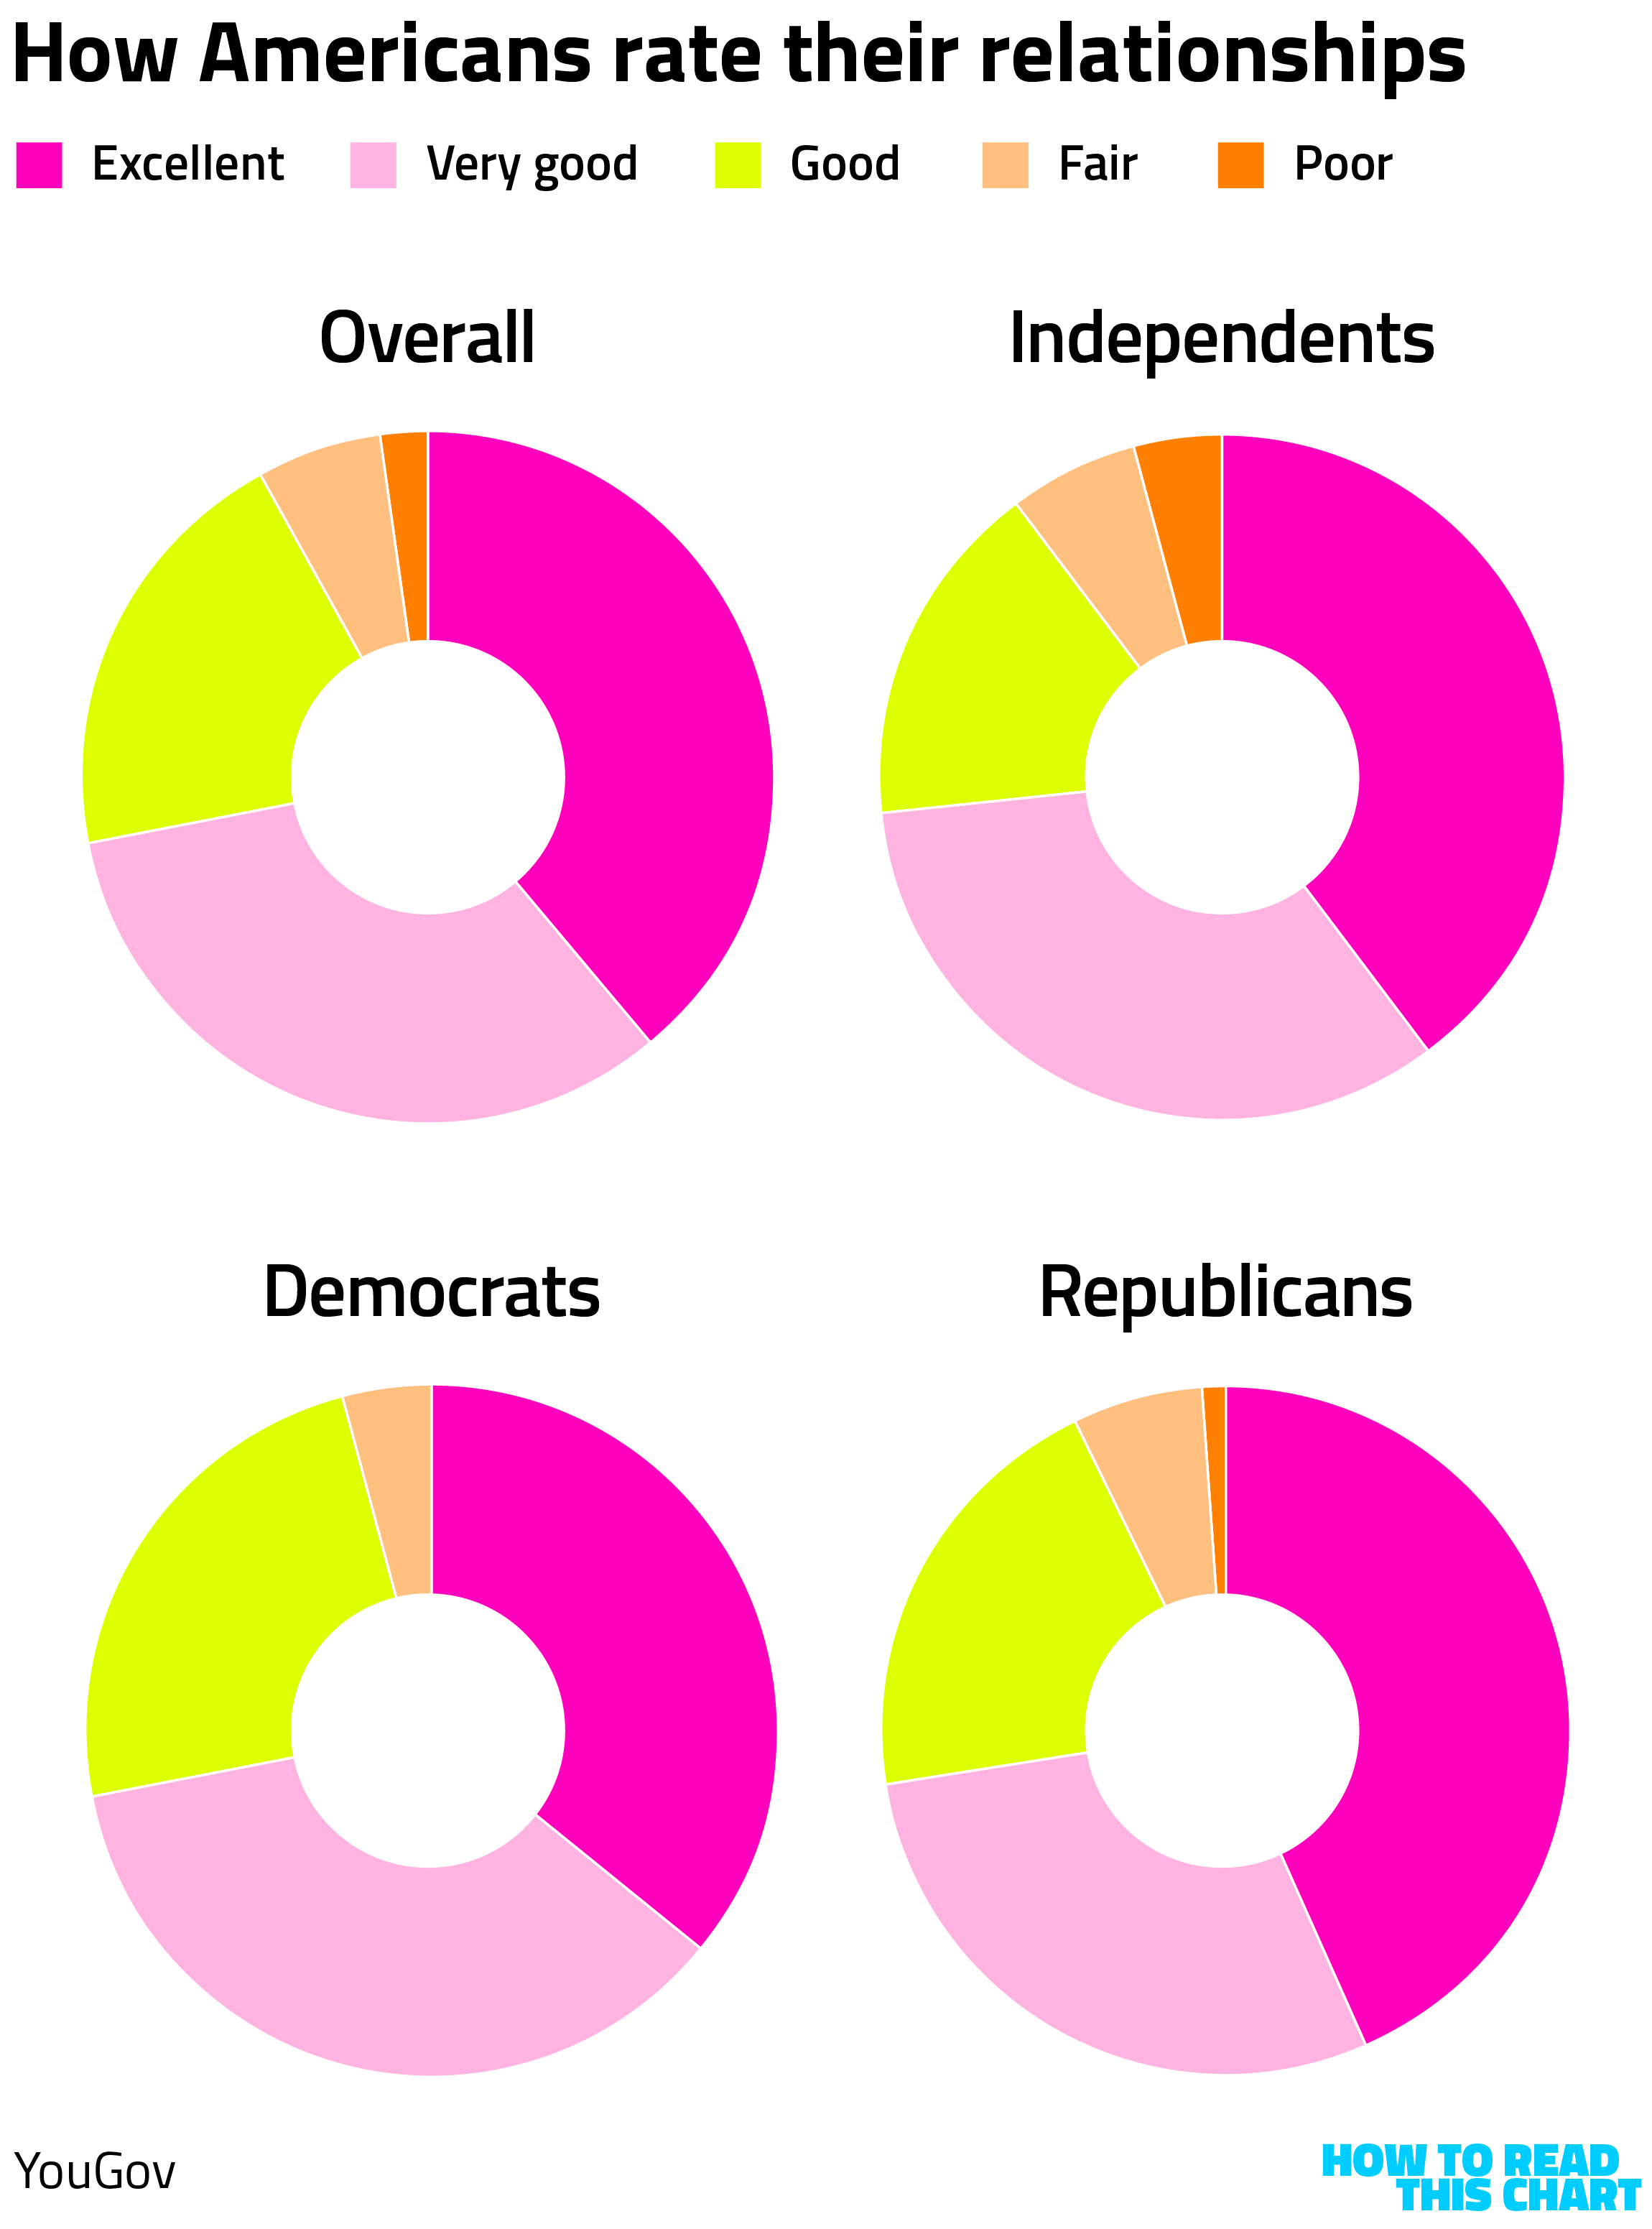
Americans who are in relationships generally say that those relationships are excellent or good, which is excellent news, or at least good. Only 8 percent of people in relationships think those relationships stink, suggesting that they might want to confer with Dr. P. Simon.
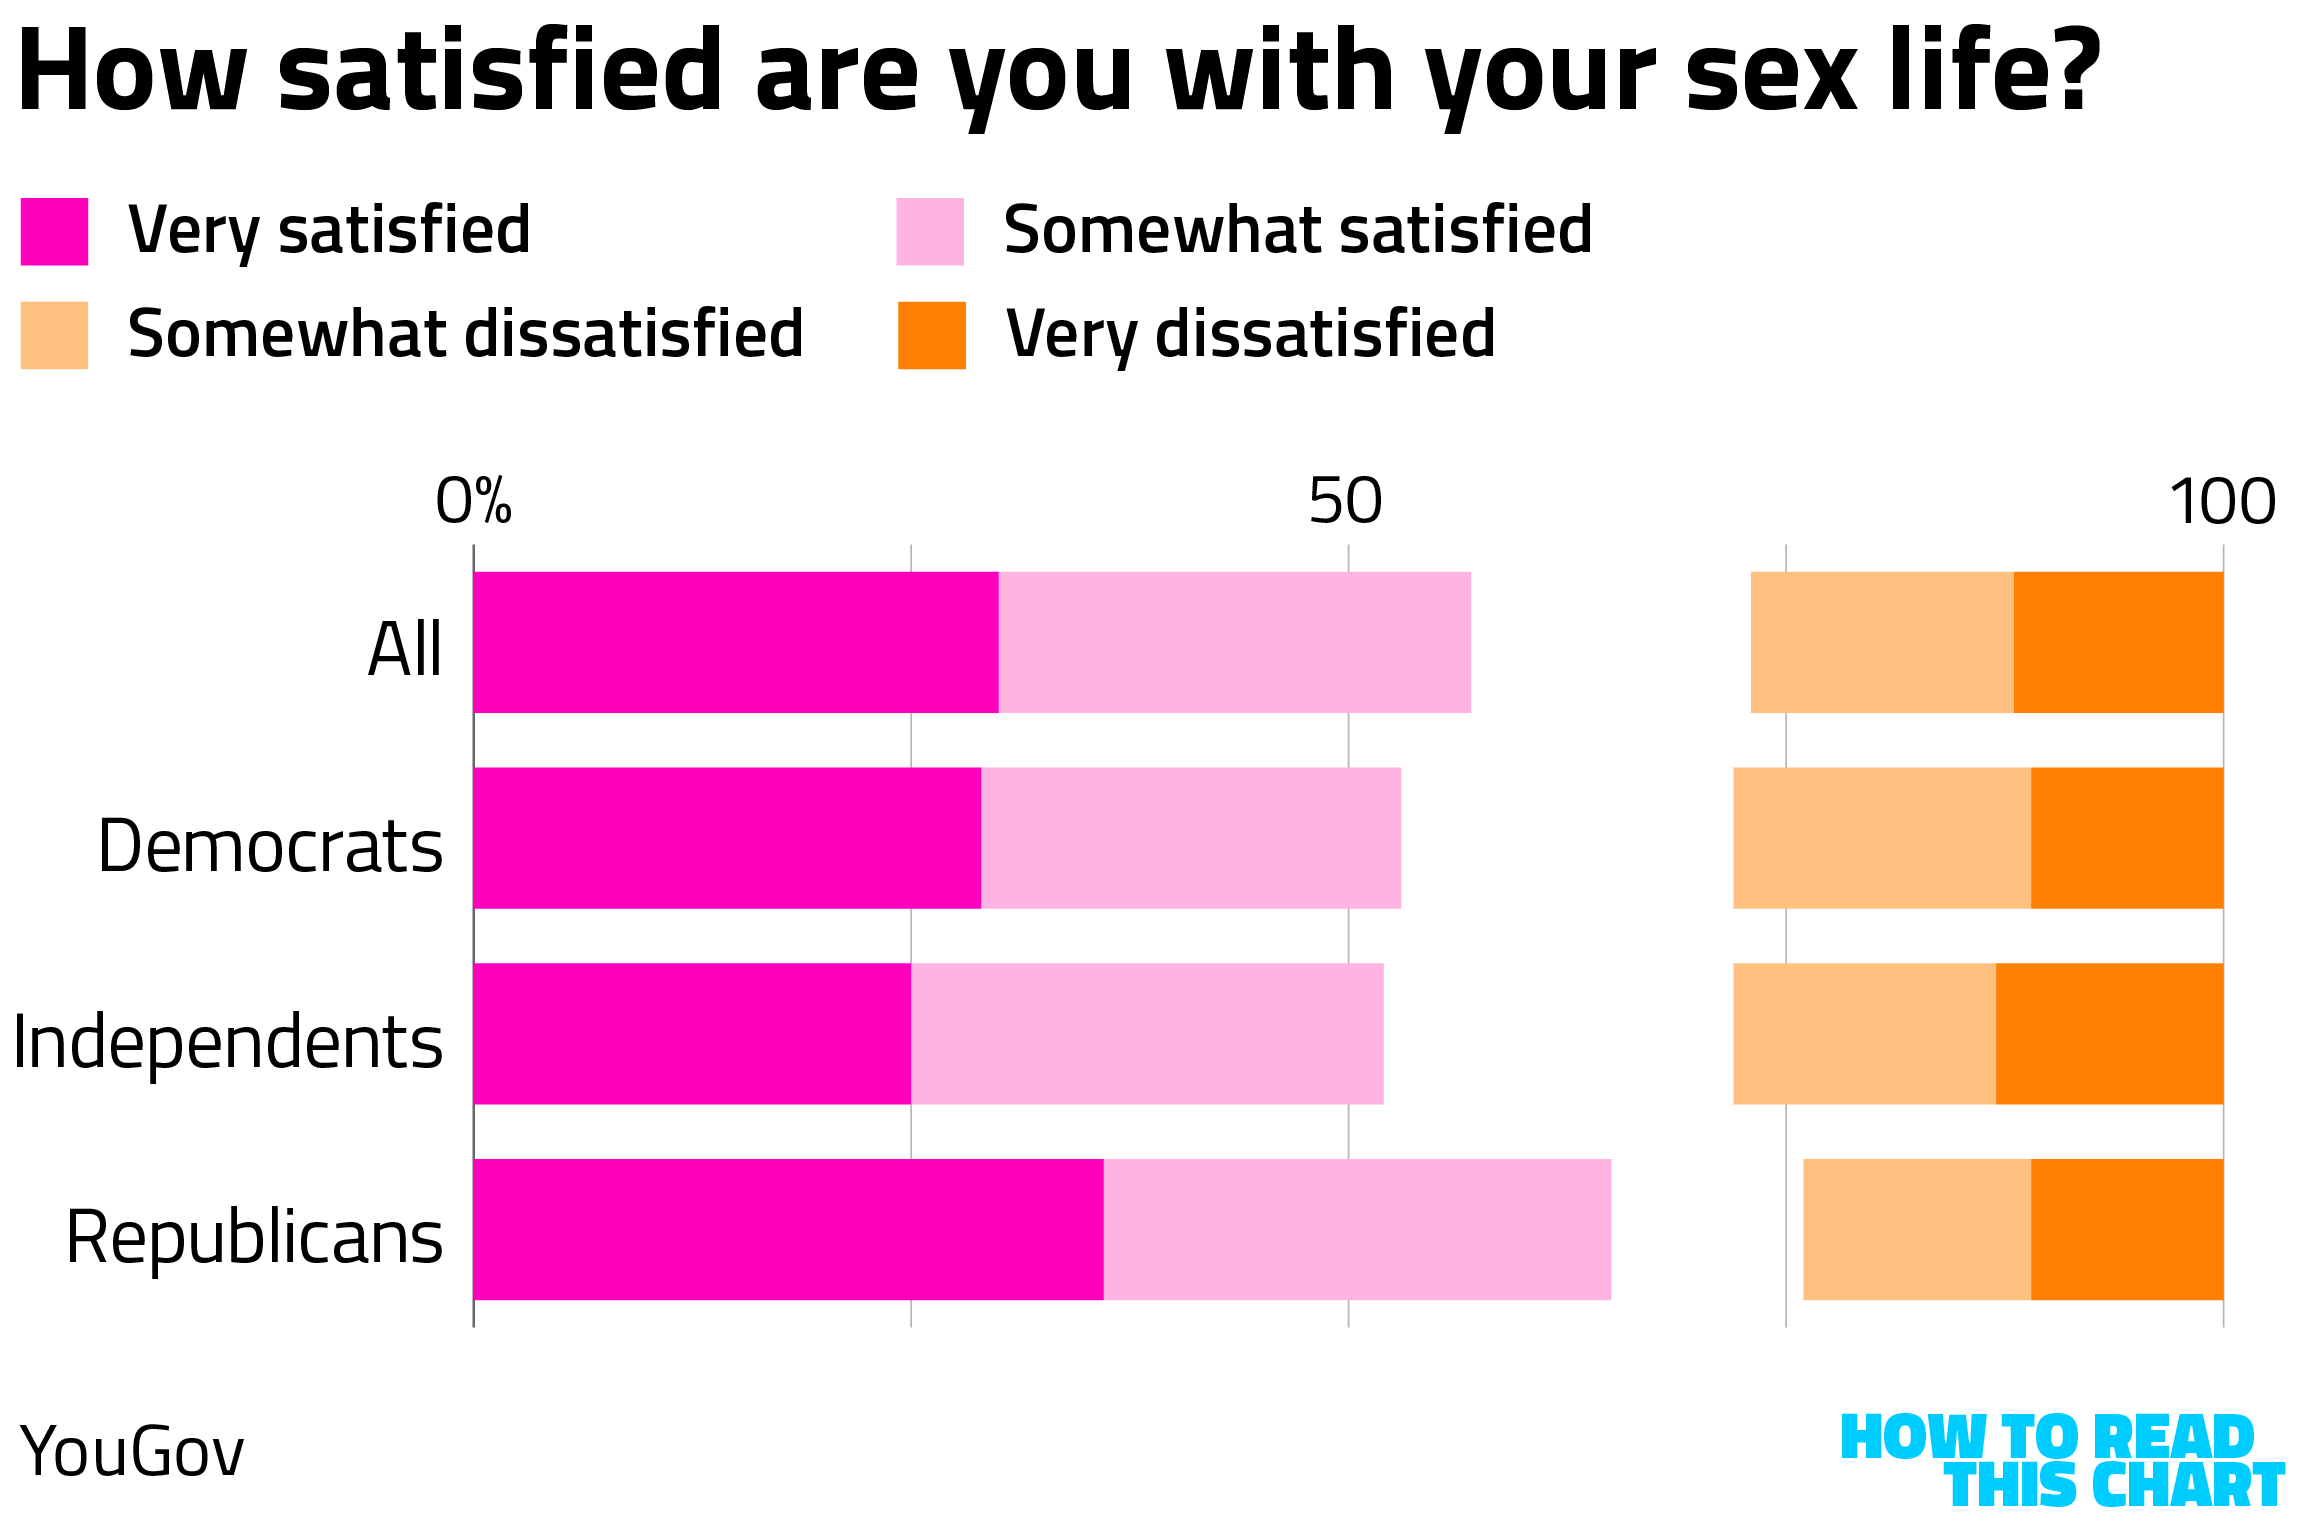
YouGov also asked about … physical intimacy, finding that most Americans give their sex lives a sometimes qualified thumbs up. But you know who really likes their sex lives? Republicans.
Republicans are outliers in other ways, too. They're significantly more likely to say that, in the past year, they told a partner that they loved them, to have been in love and, yes, to have had sex. (Independents are more likely to have used dating apps, presumably both because they're younger and less likely to be in a relationship.)
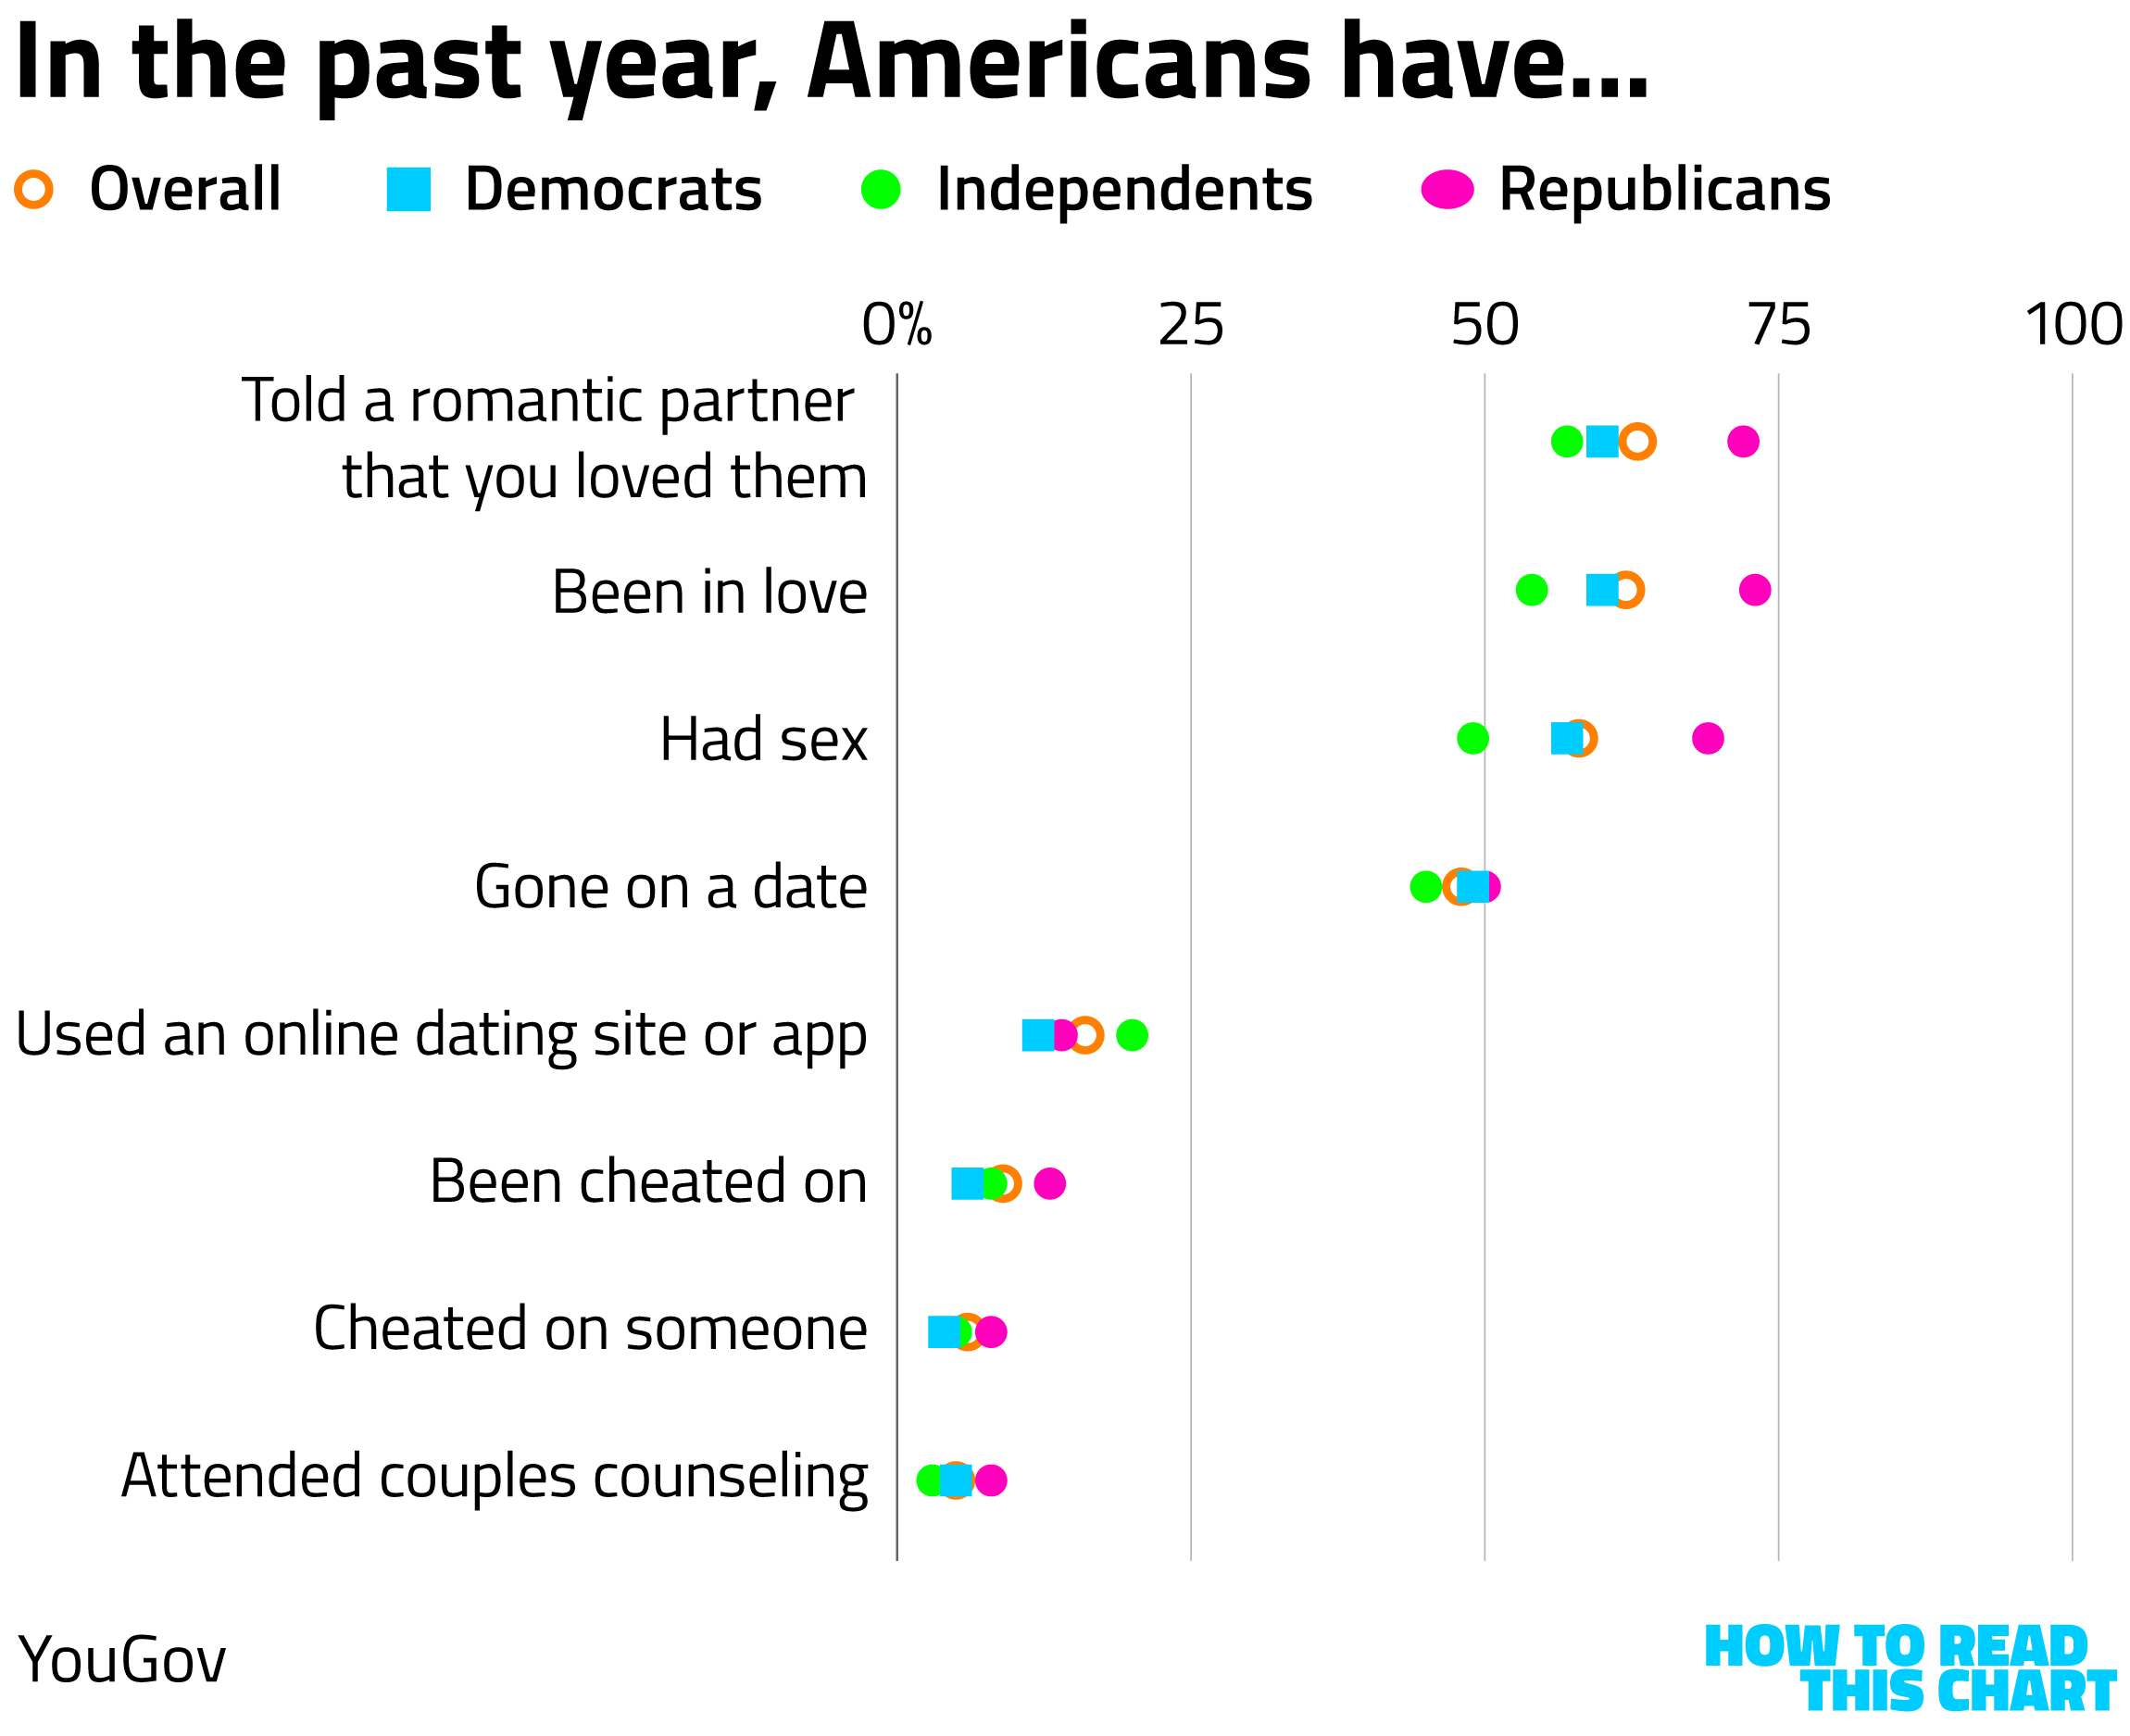
It's possible that Democrats and independents have had other things than sex on their minds over the past 390 days, but more on that in a bit.
One nice finding in the YouGov survey is that Americans generally feel loved, secured, supported and all of the other things that we are meant to feel in our relationships with other people.
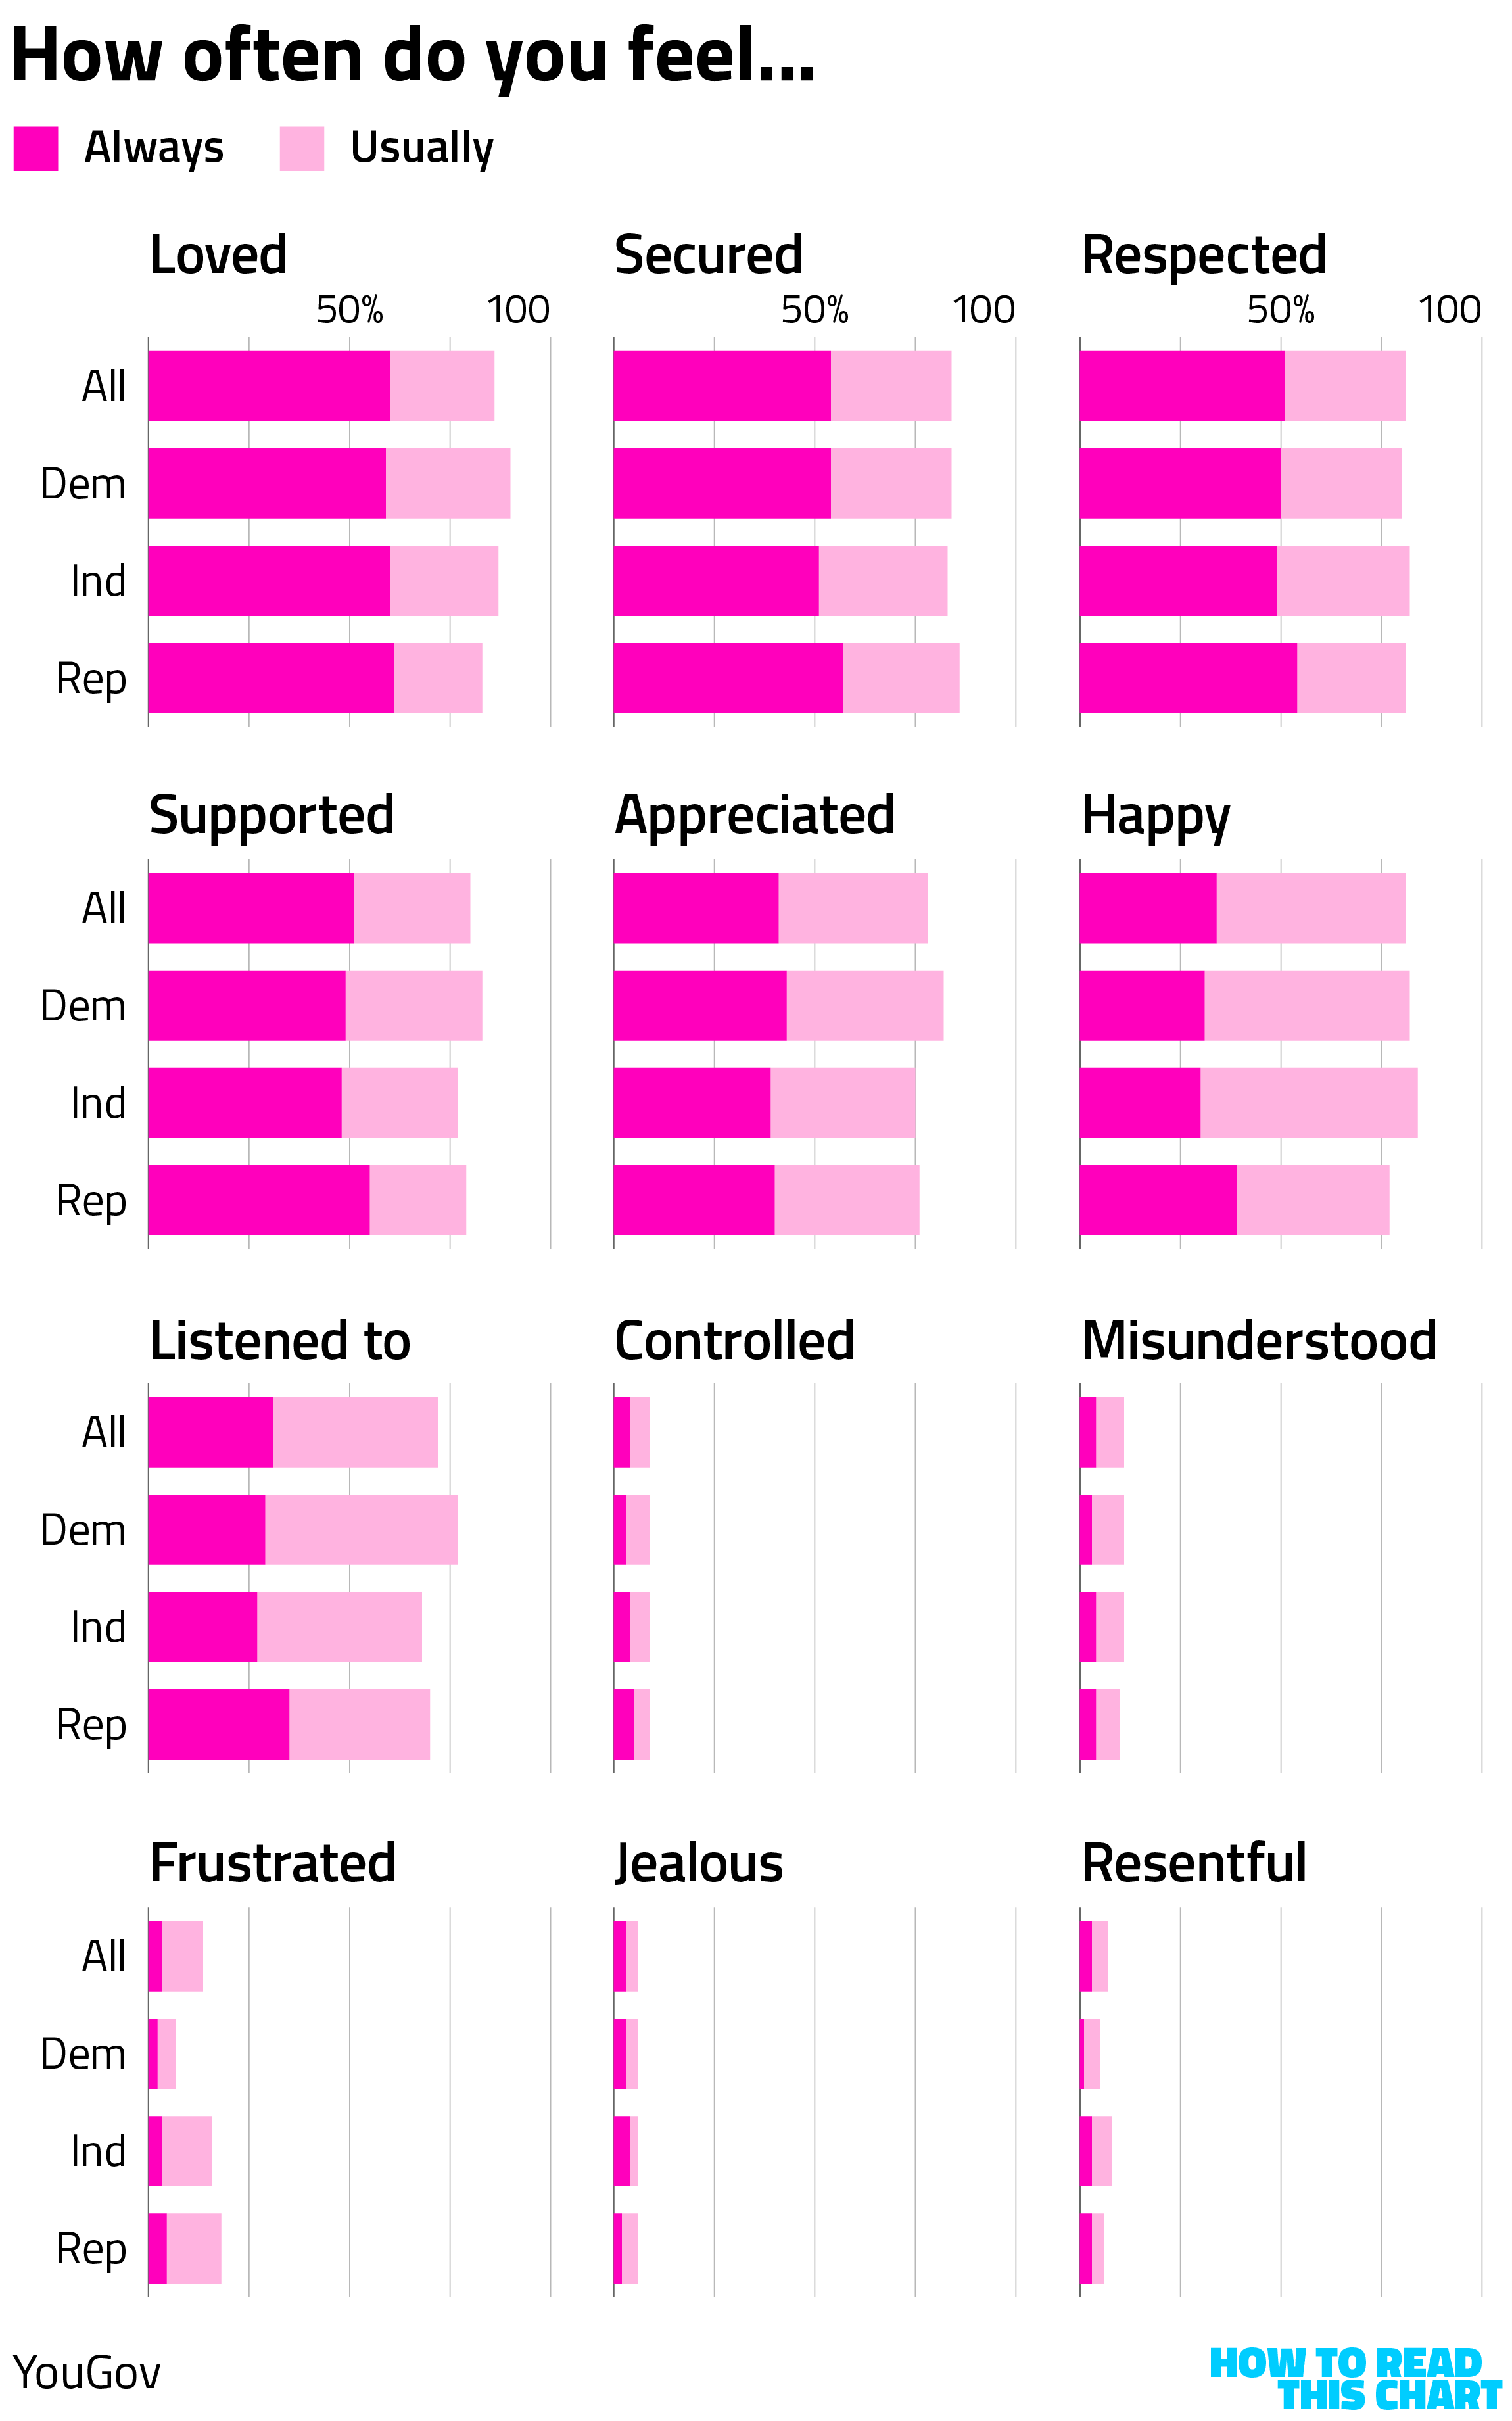
There's another partisan divide here that jumps out: Republicans are more likely to say they feel frustrated in their relationships than are Democrats.
It is very easy to look at these numbers and extrapolate all sorts of theories that comport with one's biases and assumptions. I recommend not doing so, instead spending the time that you would usually do that making your loved ones feel appreciated.
Plenty of time to be ungenerous about people tomorrow.
Chapter 2
The leaders Americans love
YouGov — have you heard of YouGov? — also asked Americans how they felt about various world leaders, yielding some interesting results.
The most popular leader, on net, was Ukraine's Volodymyr Zelensky. That, despite Republicans viewing him negatively on net because he (let's see here) doesn't get along with Donald Trump particularly well.
Republicans still generally love Donald Trump, making him one of three leaders who most Republicans have heard of and also view positively. (The other two are Benjamin Netanyahu and King Charles III.)
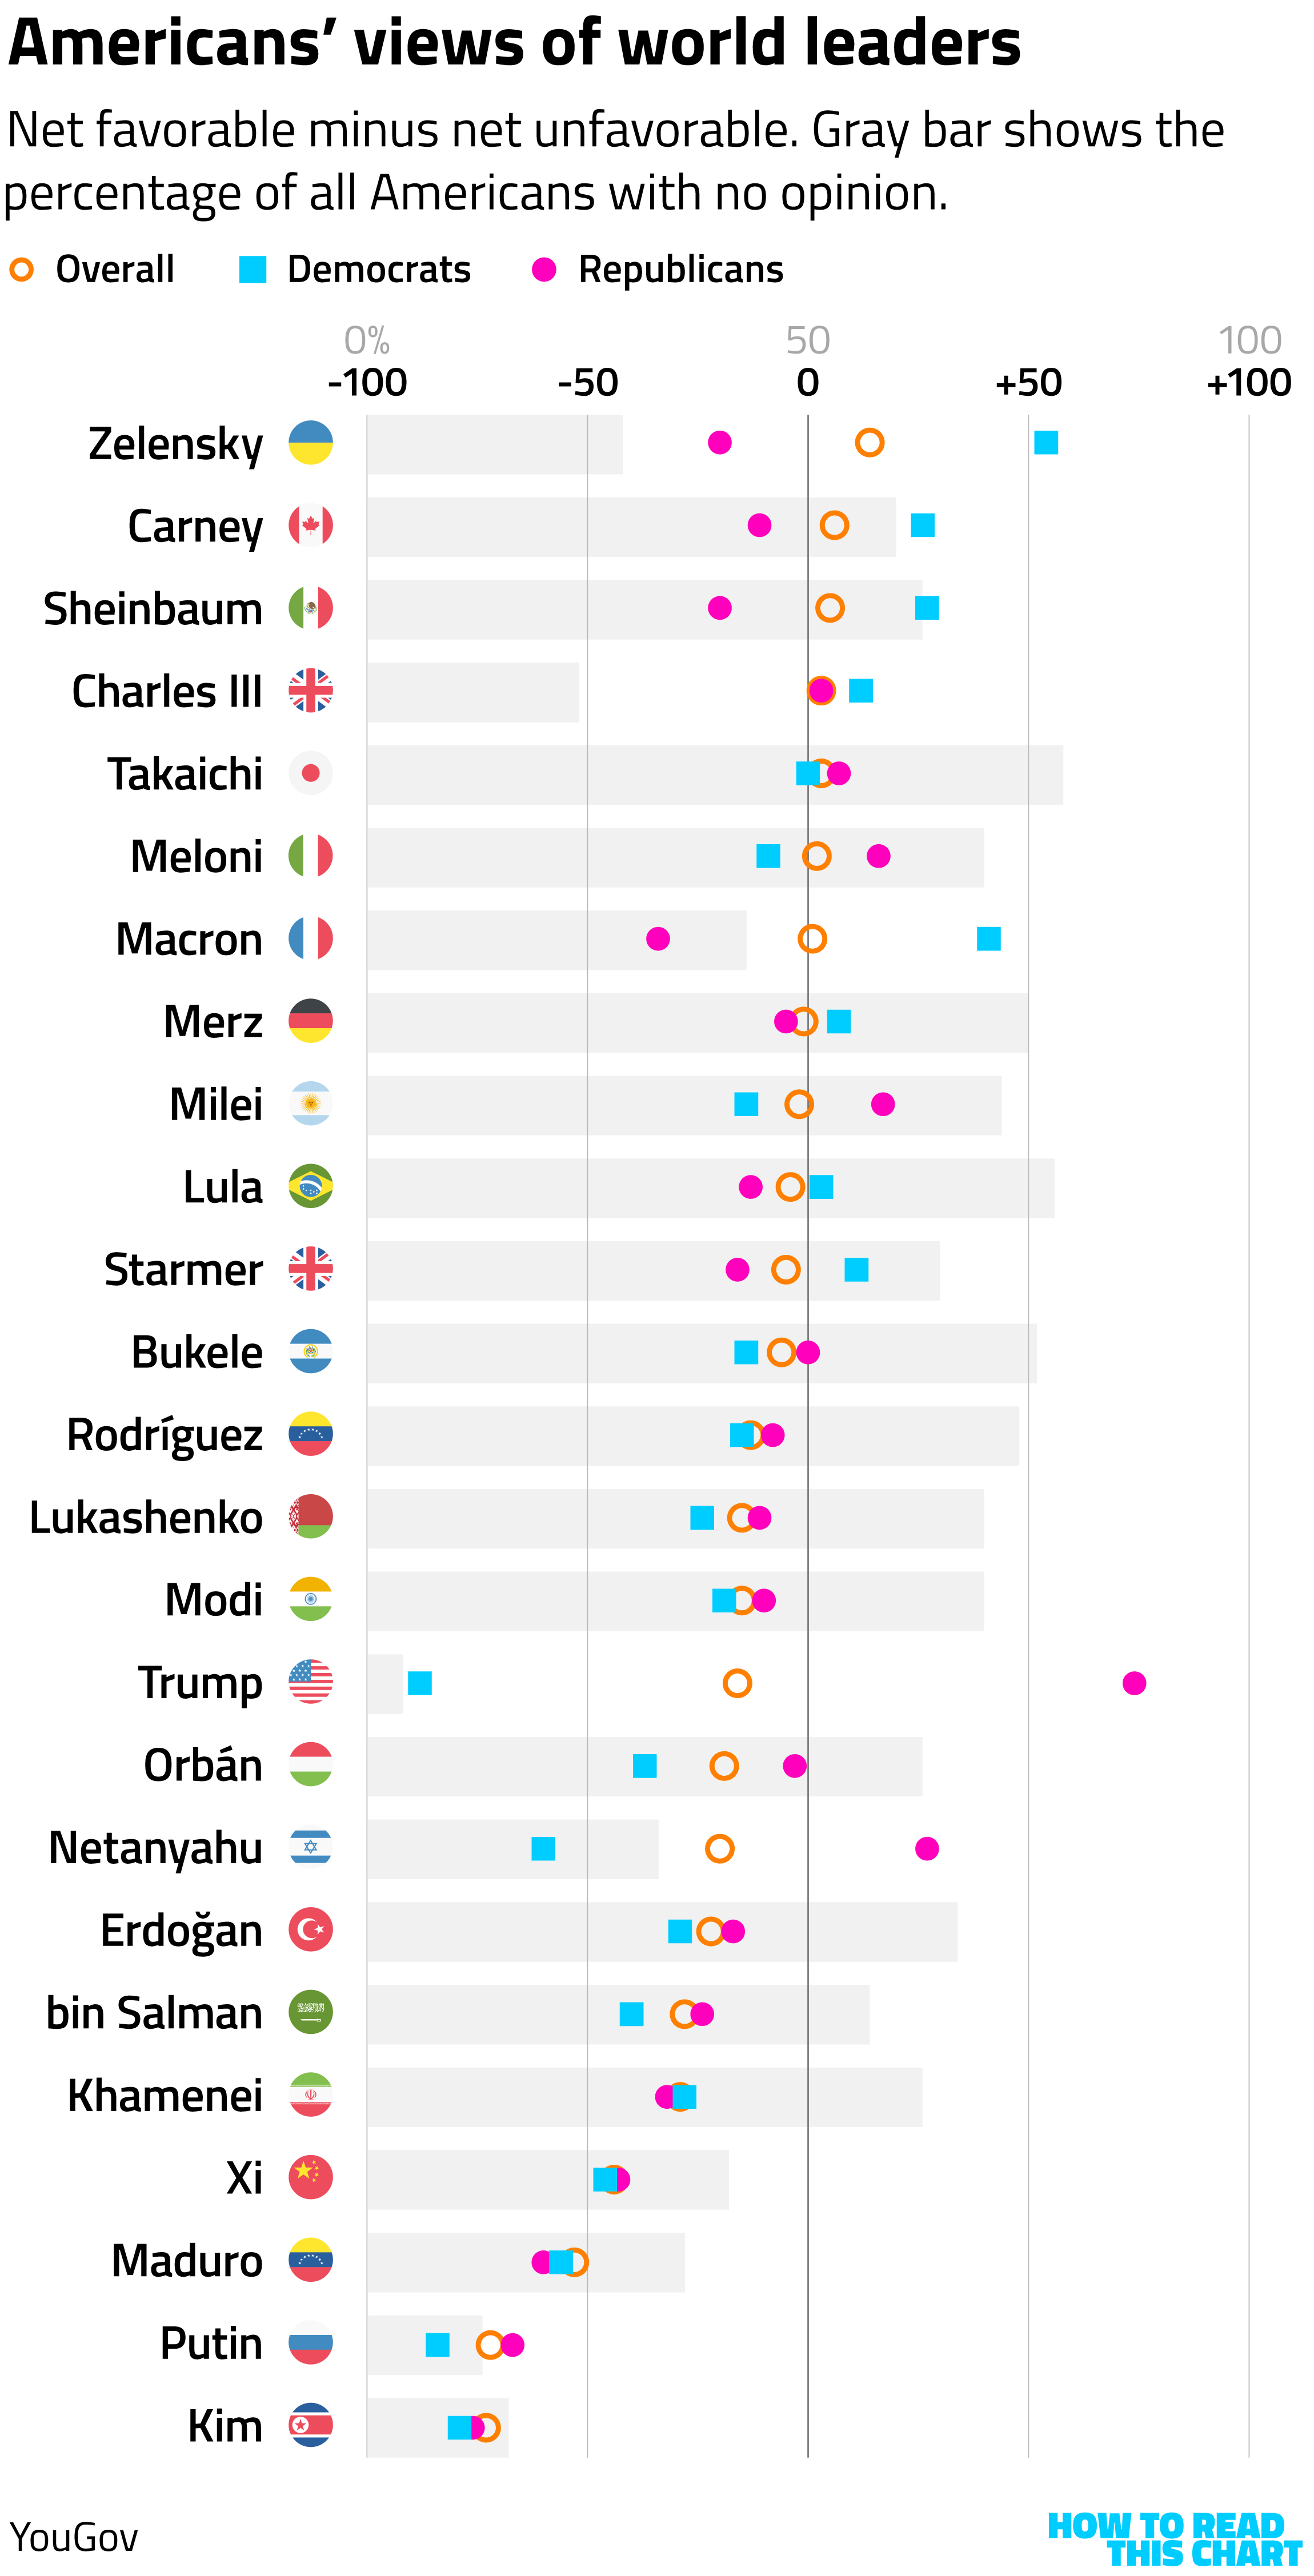
Democrats do not like Trump, viewing him more negatively than Vladimir Putin or Kim Jong Un. The only leaders known by half of Democrats and viewed positively on net: Zelensky, Emmanuel Macron (?) and, again, King Charles.
Two hundred fifty years after the revolution, the only world leader Democrats and Republicans can agree upon is the literal king of England.
Chapter 3
More about the leader Americans used to love more
Returning to Mr. Trump, YouGov — it's a polling firm! You should check them out! — also slipped an interesting question into its recent poll for the Economist.
Americans were asked whether they thought Trump was doing a better job than Joe Biden did. Biden, you will recall, was the president before Donald Trump, and whose tenure as of about a year ago was not generally viewed terribly positively. Yet, at the moment, Americans are more likely to think that Biden did better than Trump than think that Trump is doing better than Biden.
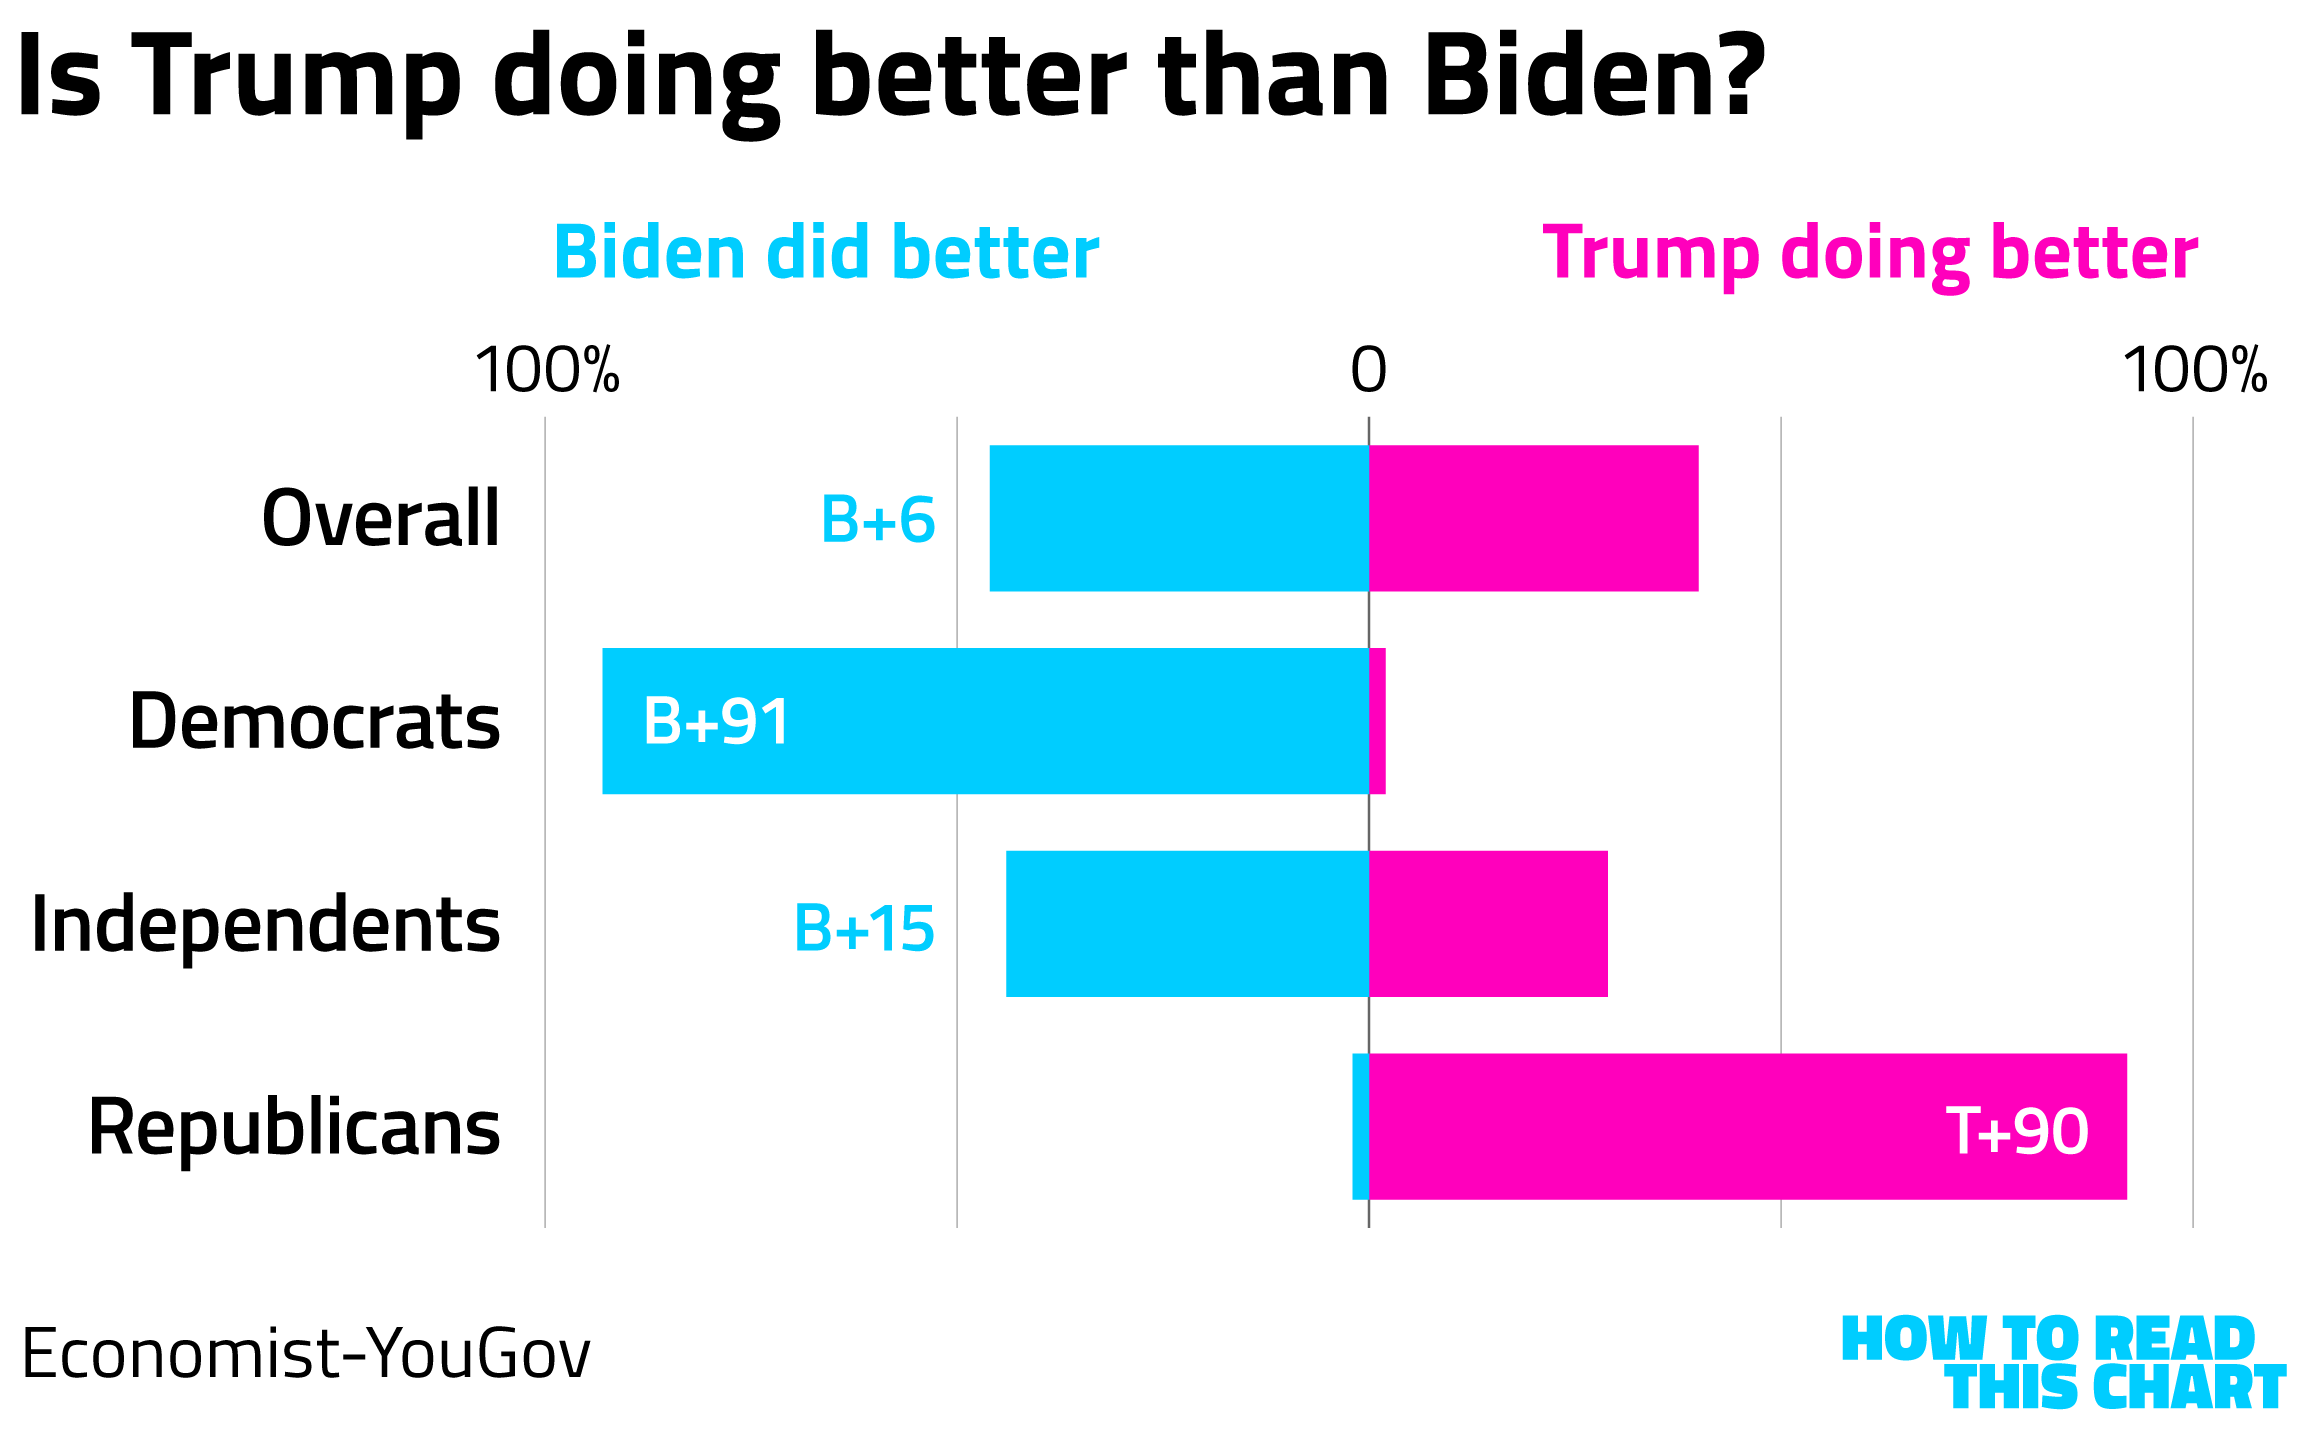
A predictable partisan split here, but clock those independents! They are 15 points more likely to say Biden did a better job, numbers that would have been useful to Kamala Harris 15 months ago but might still help her party nine months from now.
While I have you here, I wanted to add onto a theme that I first raised a few weeks ago: the softening of Trump's support within his base. This week, Pew Research Center looked at another subset of that population, finding that White evangelical Protestant support for Trump has softened since a year ago.
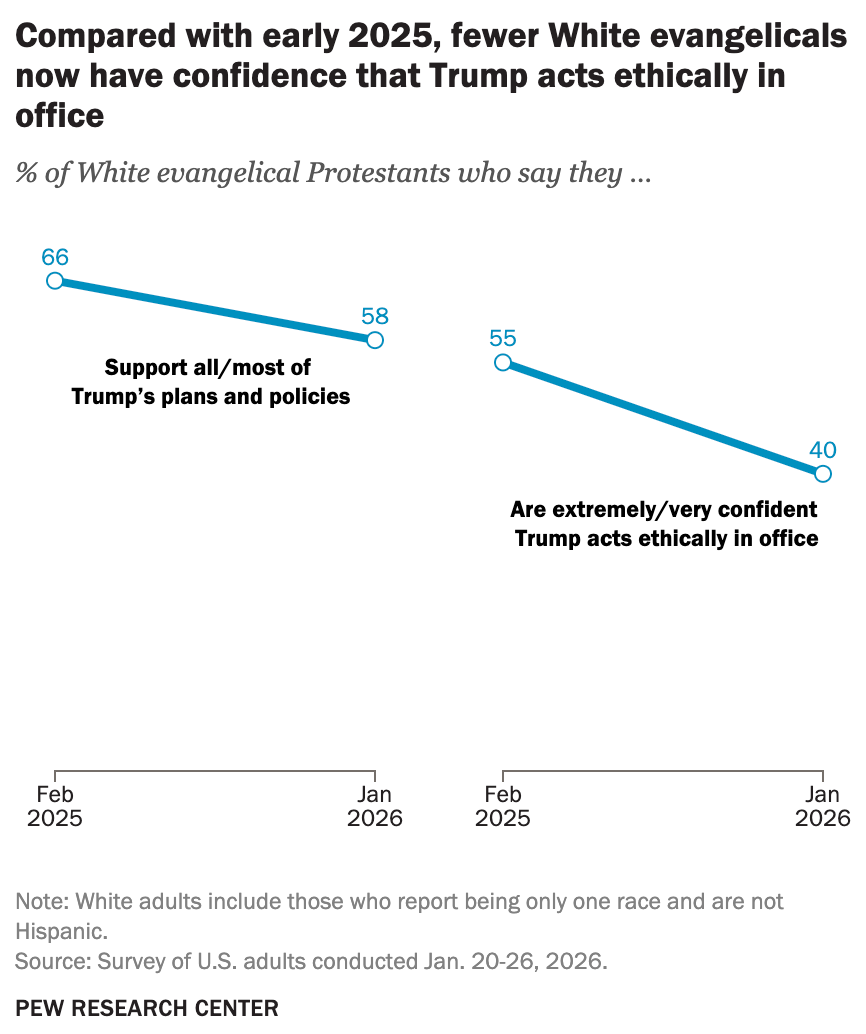
Note, too, that only 4 in 10 evangelicals now say that they're confident Trump acts ethically in office. Again, there's plenty of time to be ungenerous about people tomorrow.
Chapter 4
Americans used to love all our leaders more
There was other polling-related news this week: After more than three-quarters of a century, Gallup is ending its measurement of presidential approval.
The reasons for this are numerous and not entirely unexpected. Polling is generally trickier than it used to be, as you've likely heard, and there are a lot of other pollsters already generating this particular data point. It is, a spokesman told The Washington Post, no longer "an area where Gallup can make its most distinctive contribution."
But there is one likely contributing reason that I haven't seen mentioned much: Approval ratings don't serve as a barometer of opinion as much as they used to.
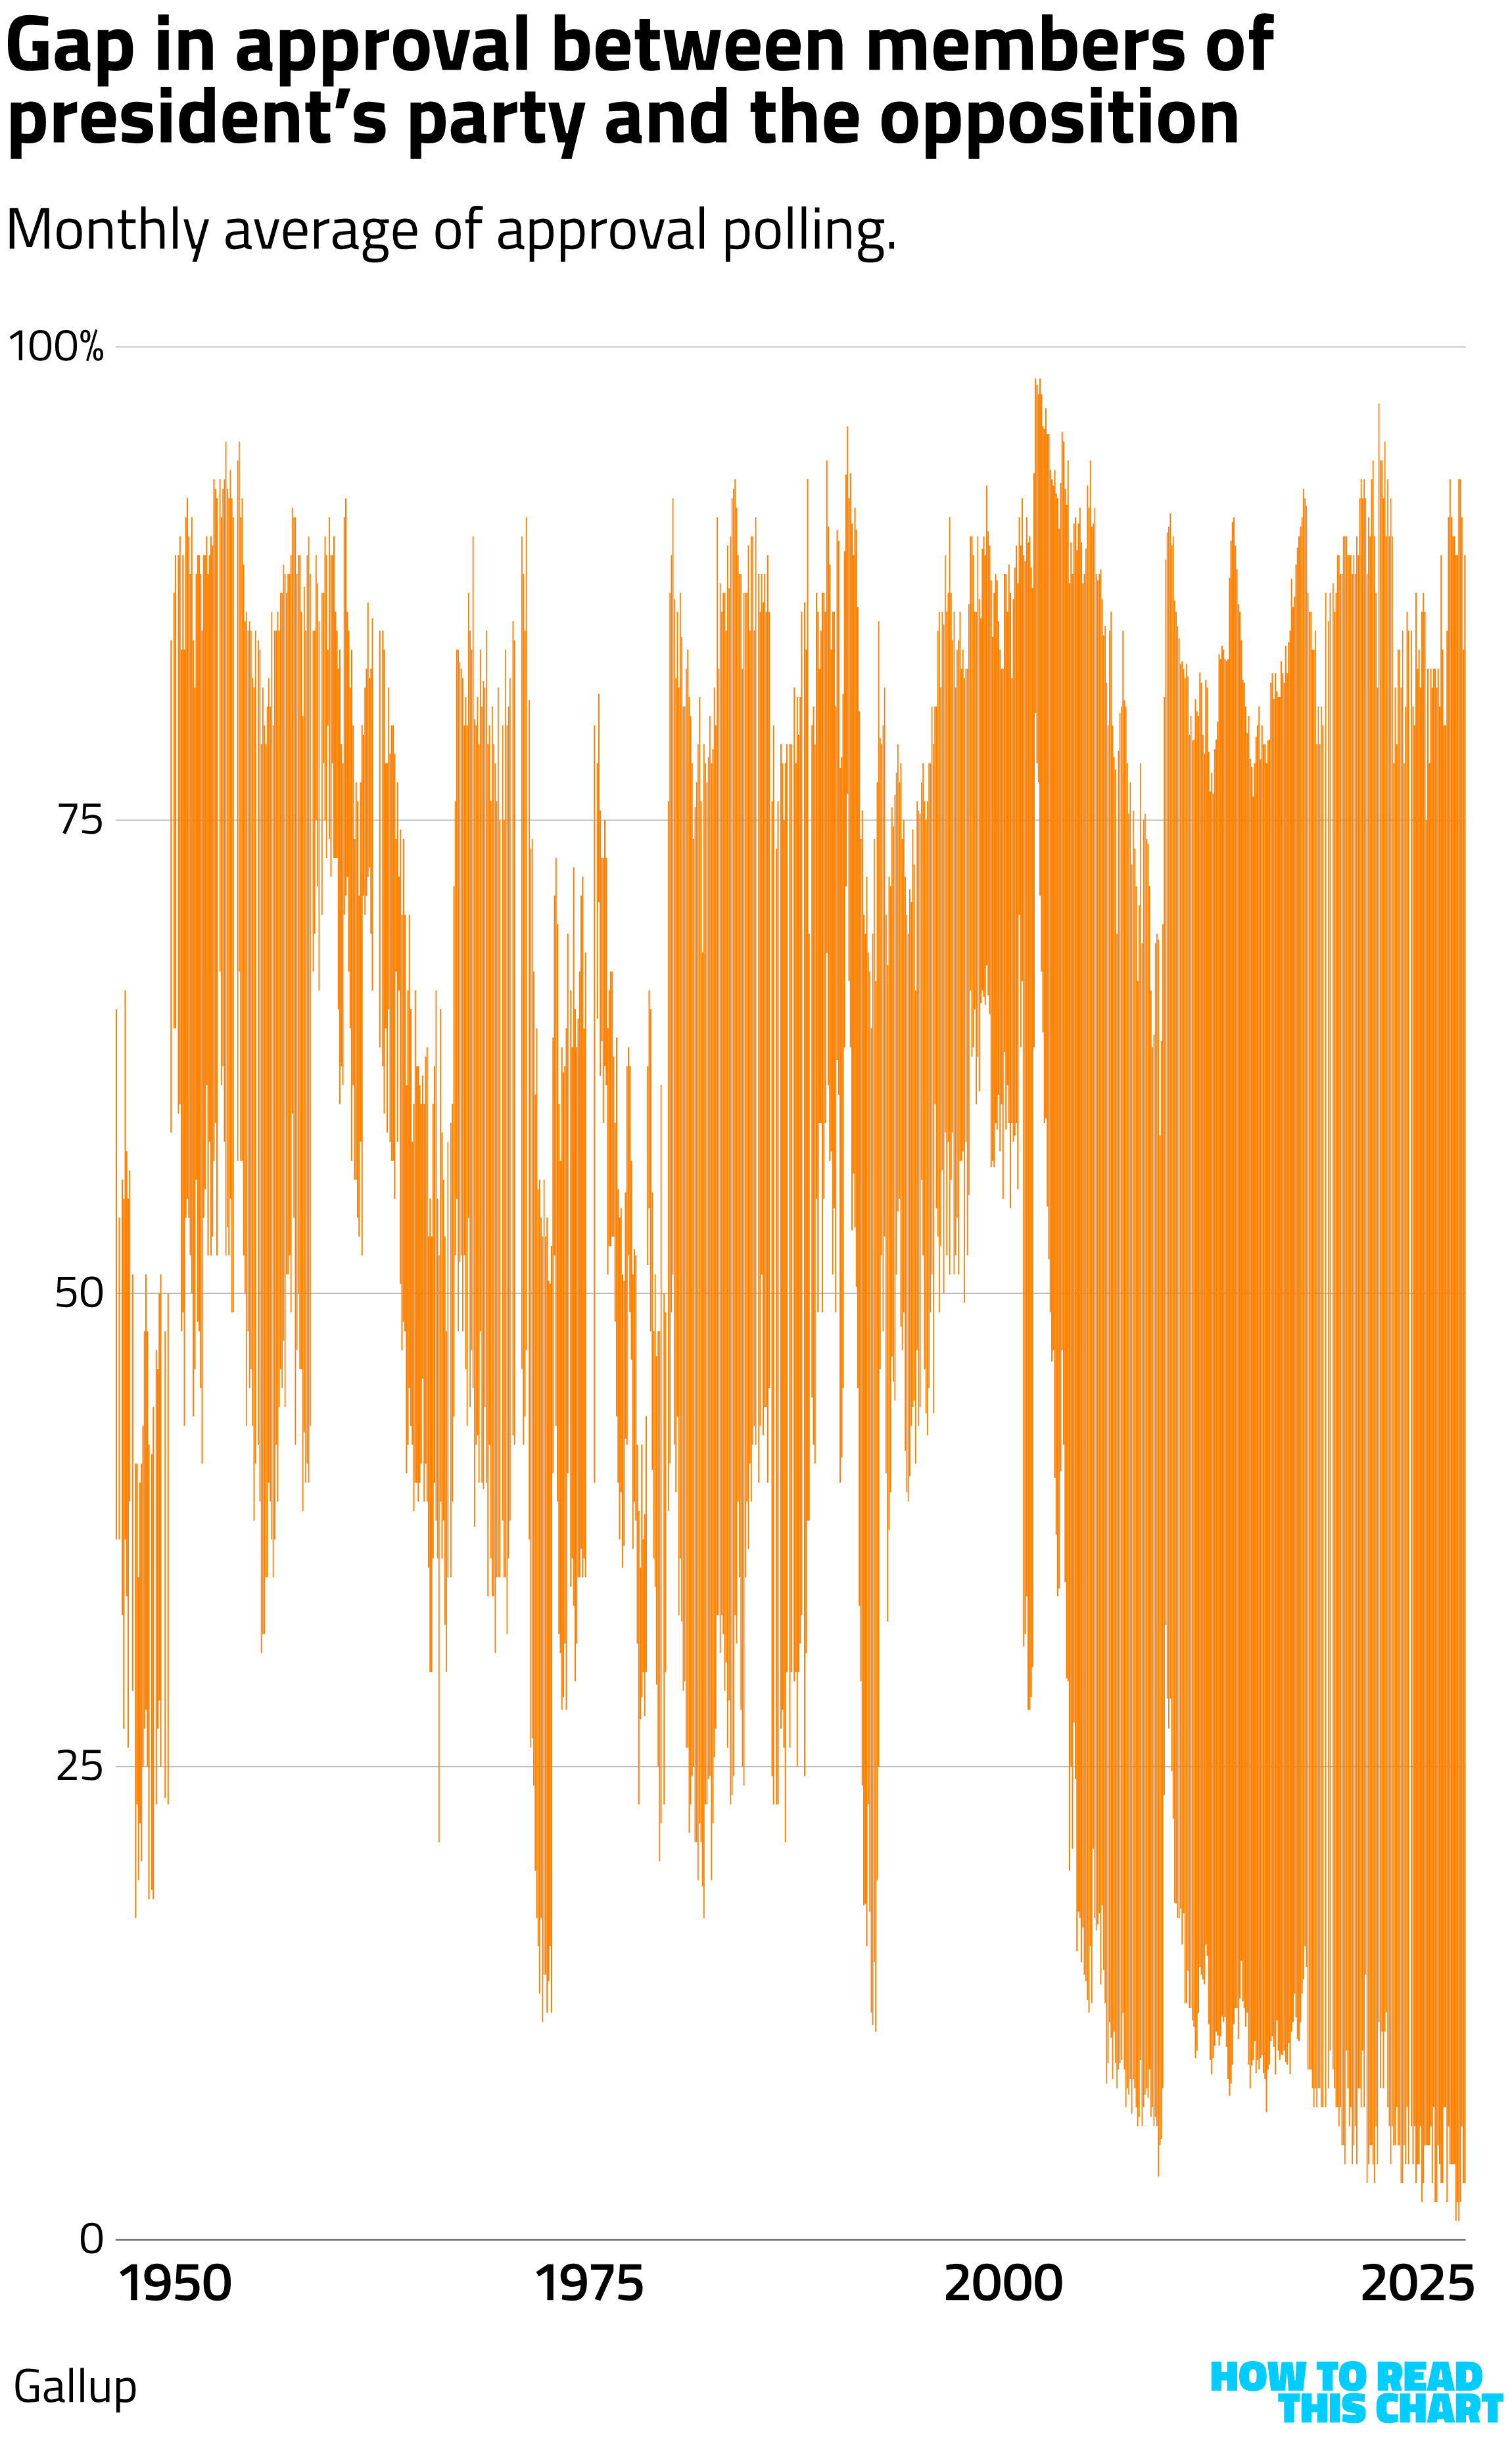
Here's what I mean by that. In the 1960s, the average gap in approval between members of the president's party and the opposition was about 23 points. By the 1980s, it was 47 points. In the 2000s, it was 58 points. This decade? The average has been more than 80 points.
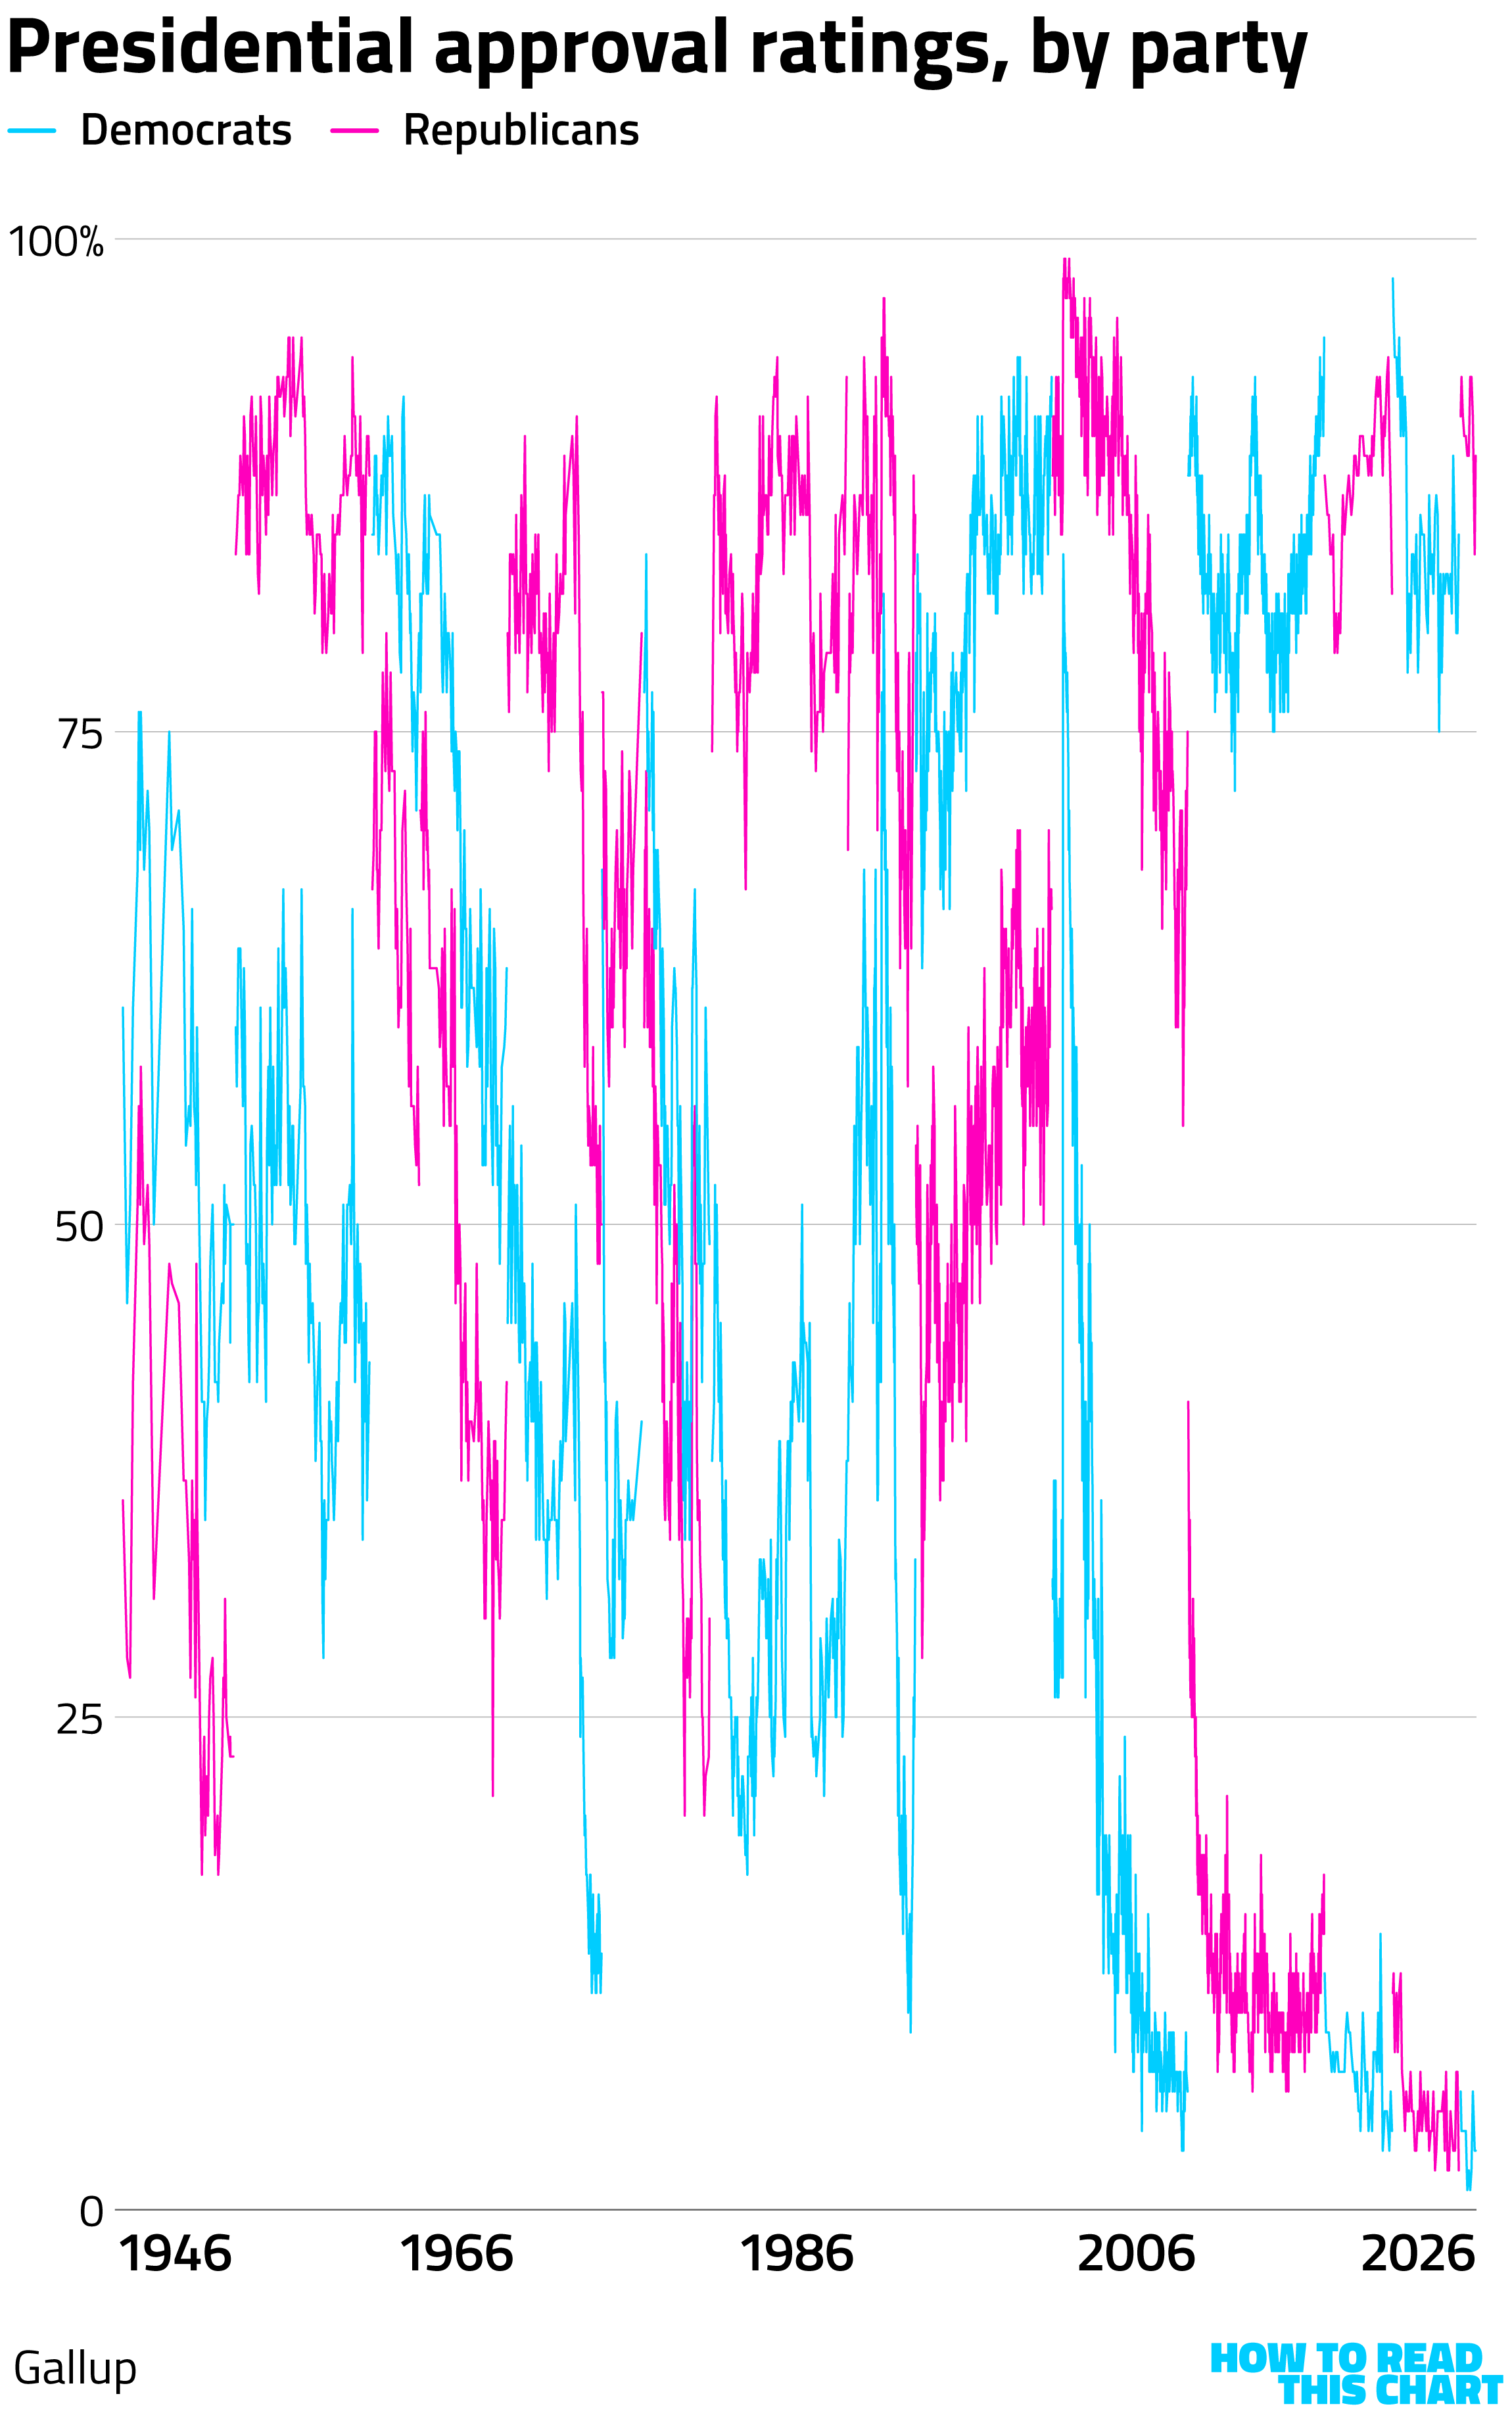
Over the past 15 years, the opposition party has calcified into strong disapproval of the president while his own party has remained heavily supportive. These views are generally pretty static, meaning that there's not much movement possible in the overall approval number.
You can see that lack of movement below, plotting the end date of each Gallup poll.
Or, looking at it another way, here's the gap between the parties on average each month. A big gap means little movement.
This is why I always cringe a bit when I hear commentary suggesting that Trump's approval rating has cratered or plunged. It hasn't! His approval rating is crummy, and near or at lows both for him and his predecessors, but he didn't start out all that much higher. This isn't a George-W.-Bush-ian drop from the 90s to the 30s. It's a drop from the mid-40s to the high-30s, because partisans simply don't move that much.
So why even ask the question?
Chapter 5
The Valentine's tax
Hey, have you noticed that things are more expensive than they used to be? This is probably one reason that Trump's poll numbers have cratered: his pledge to lower prices has not (with the exception of eggs) come to fruition.
Of course, Trump bears a lot of blame for this. There have been a number of recent analyses showing that the billions of dollars raised from imposing tariffs have come not from foreigners (as Trump claims) but from Americans (as everyone else already knew).
Put visually:
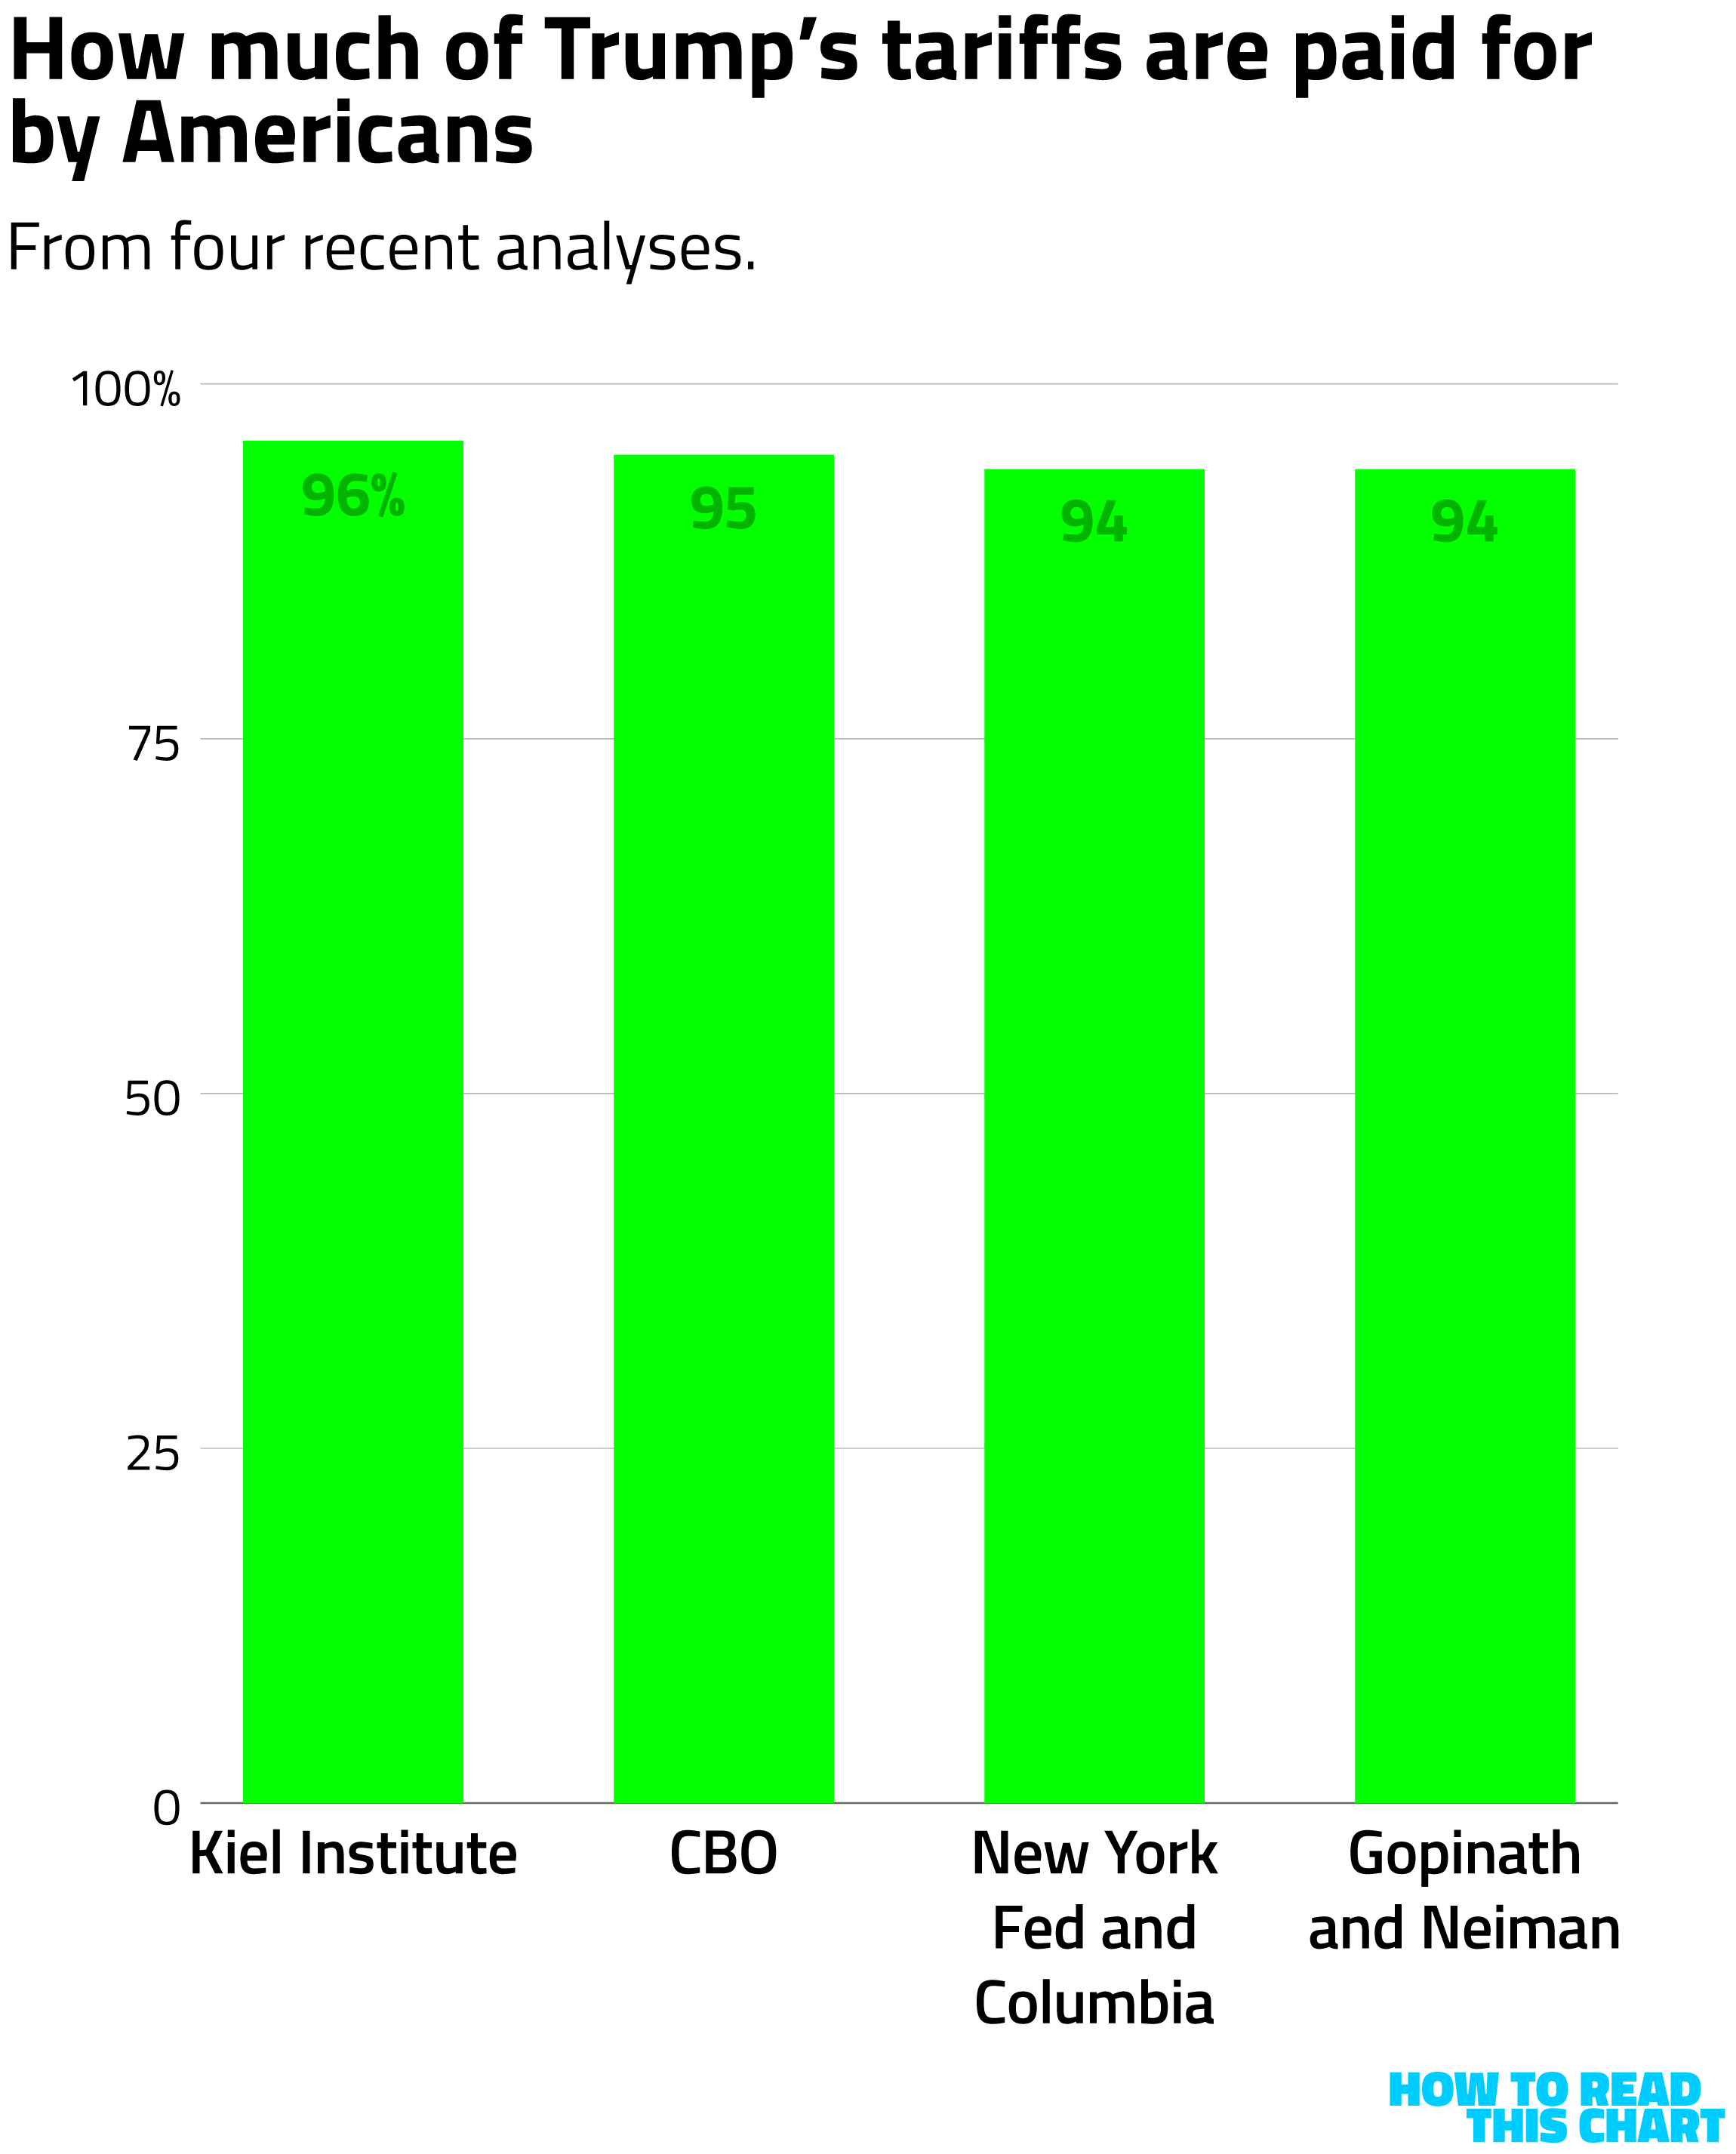
If you want the sources for those numbers, here you go: Kiel Institute for the World Economy, CBO, Federal Reserve Bank of New York and Columbia University and academics Gita Gopinath and Brent Neiman.
Luckily, Americans love surreptitious taxes, so it's a happy Valentine's Day all around.
Chapter 6
Chart Attack
Before 59 percent of you stop reading this email in order to spend time with your significant other (and before the other 41 percent of you return to not doing that), we will enjoy Chart Attack. Which, longtime subscribers might remember, derives its name from "heart attack," which is a nice little Valentine's Day tie-in. (A heart attack is when your heart breaks.)
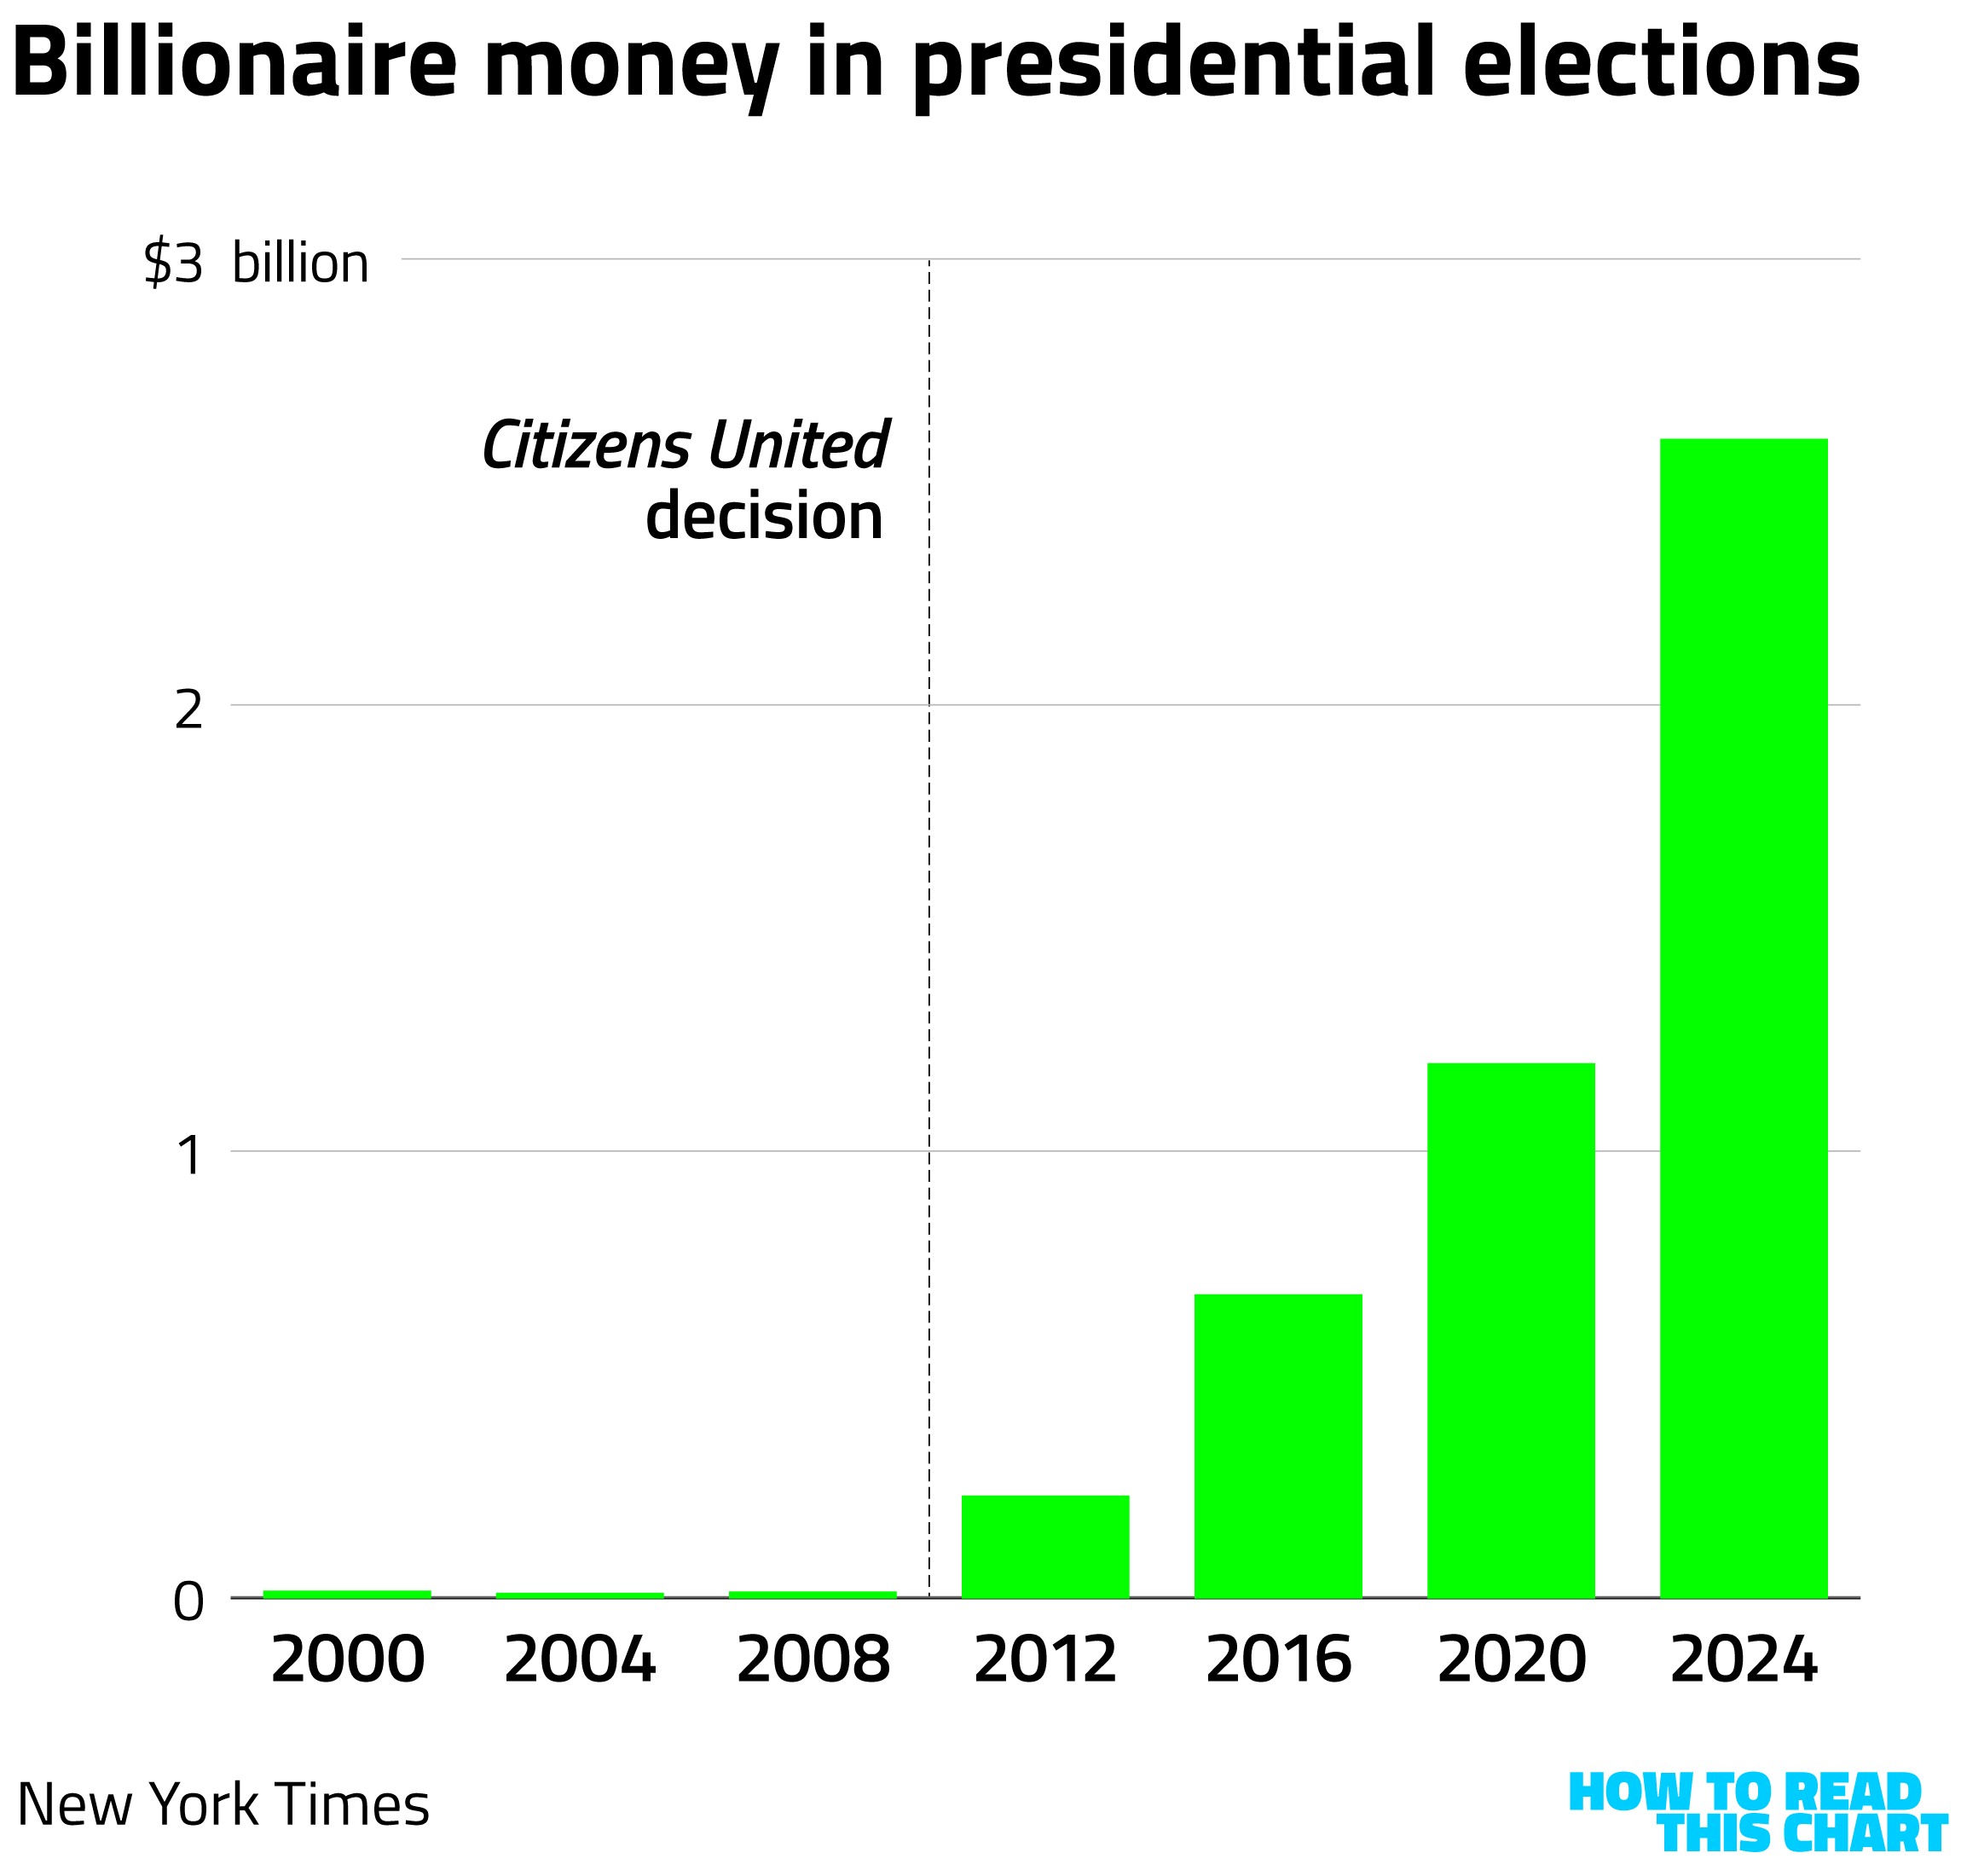
The New York Times compiled data on how much billionaires have spent on recent elections, pointing to the relaxation of rules that accompanied the Citizens United decision. A trend does sort of jump out at you, doesn't it?
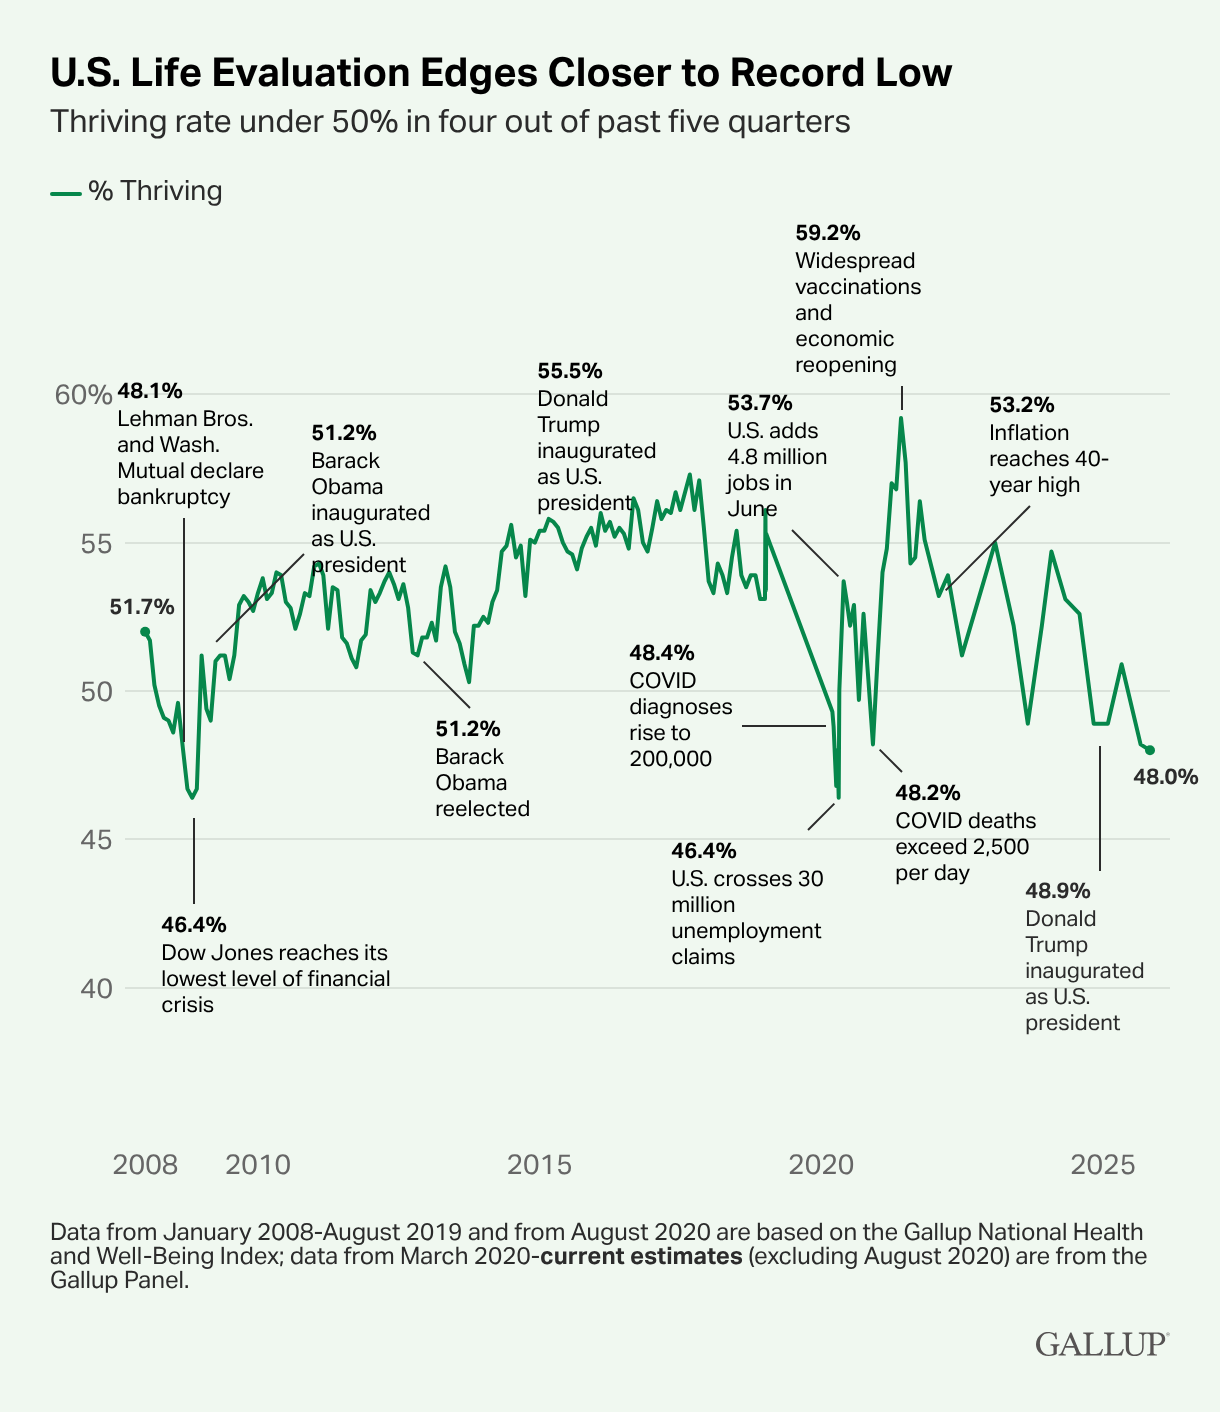
In some of the polling Gallup will keep doing, the firm found that Americans are less likely to describe themselves as thriving than at just about any prior point in the past two decades.
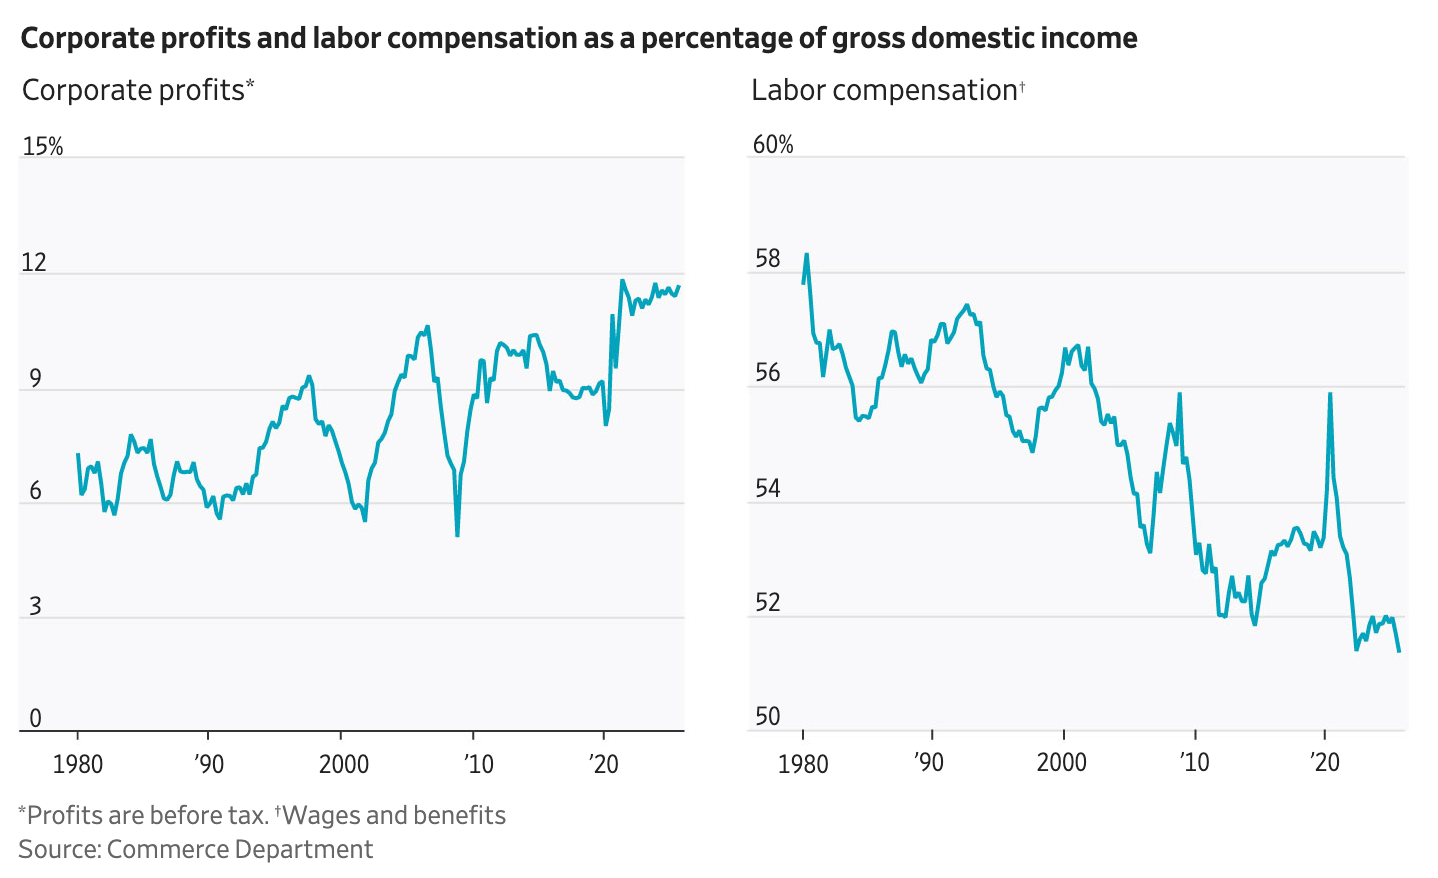
The Wall Street Journal, meanwhile, finally got around to reading that copy of Das Kapital that someone left at their holiday party.
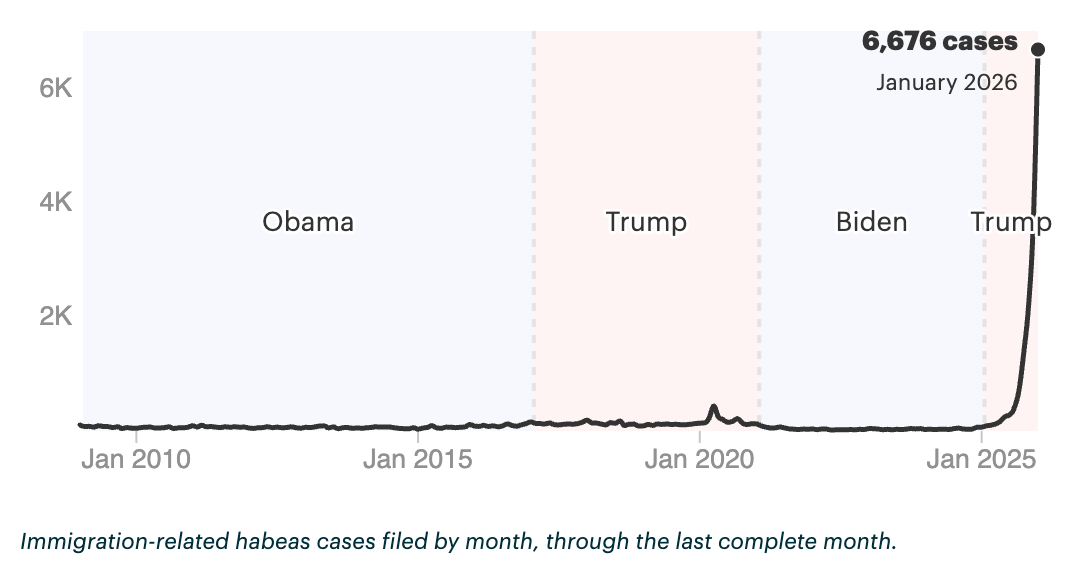
ProPublica continues its exceptional journalism by tracking the number of habeas cases filed on behalf of immigrants each month in recent years.
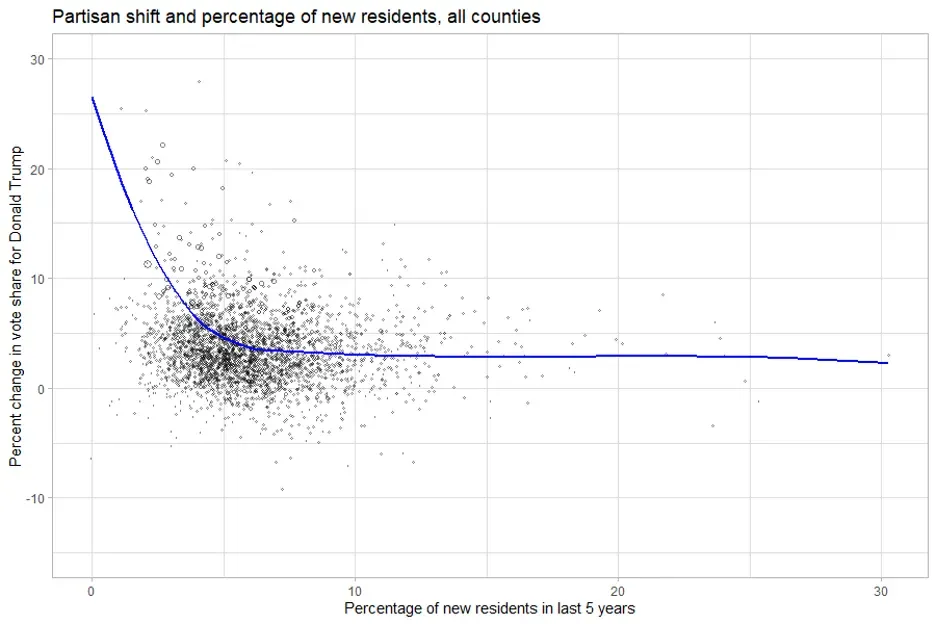
Research from the Tufts (University) Public Opinion Lab found a correlation between Trump support in 2024 in a county and a lack of new residents.
Meanwhile, data centers are using more power…
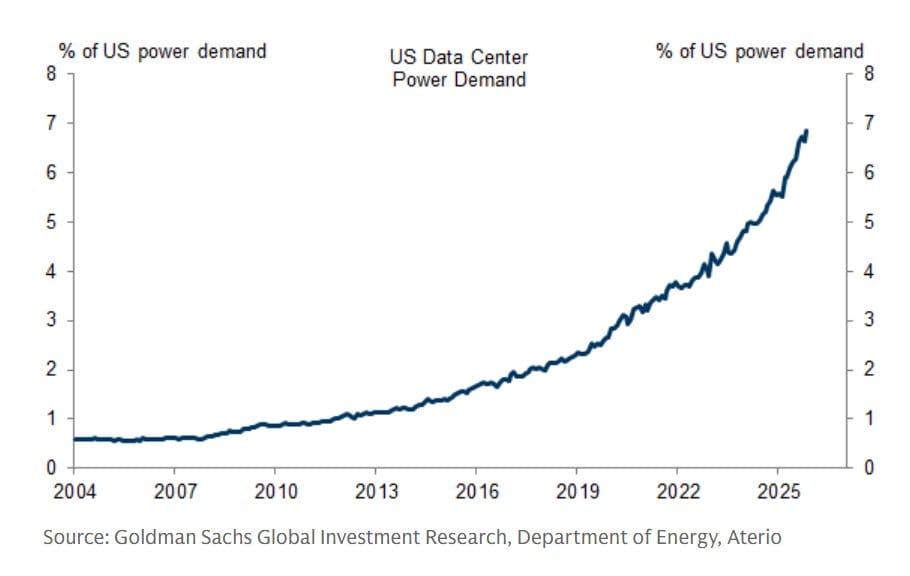
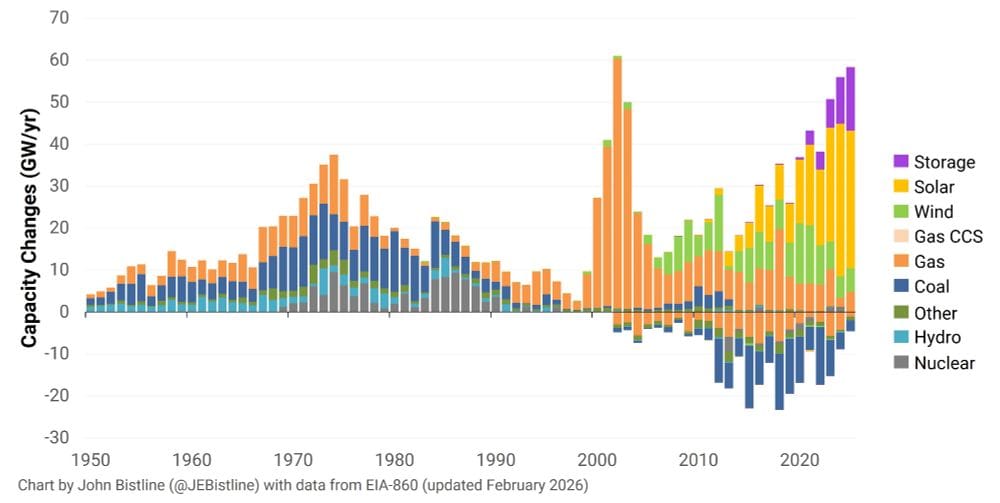
…as more power generation comes from renewable sources.
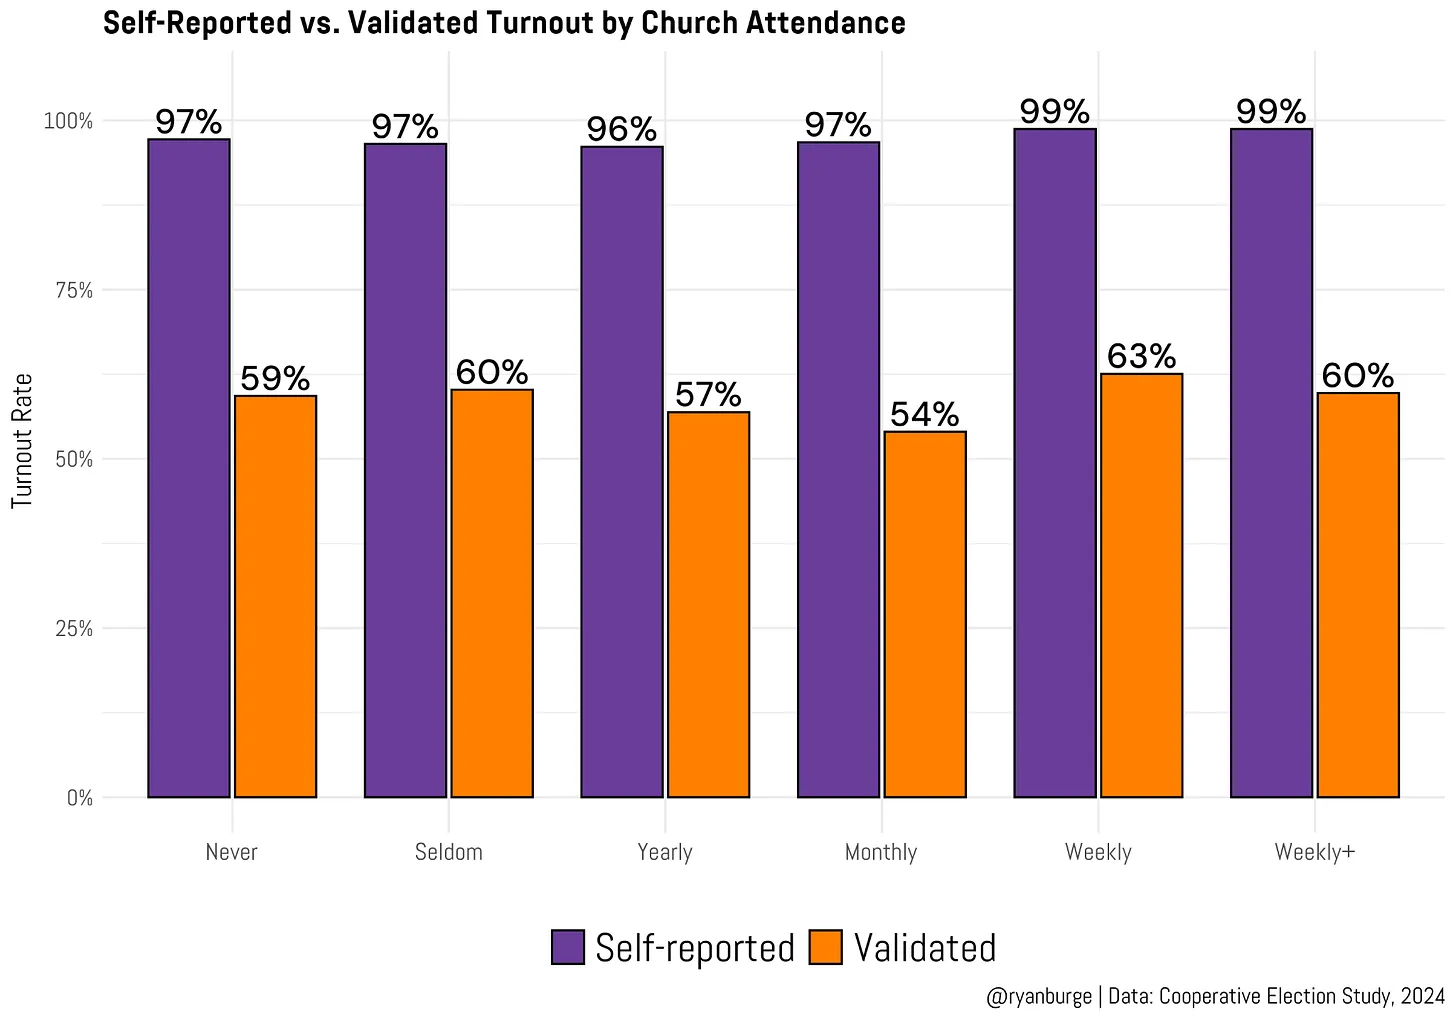
Returning to our theme of religion and ethics, Ryan Burge found that more religious people are just as likely to lie about having voted as everyone else.
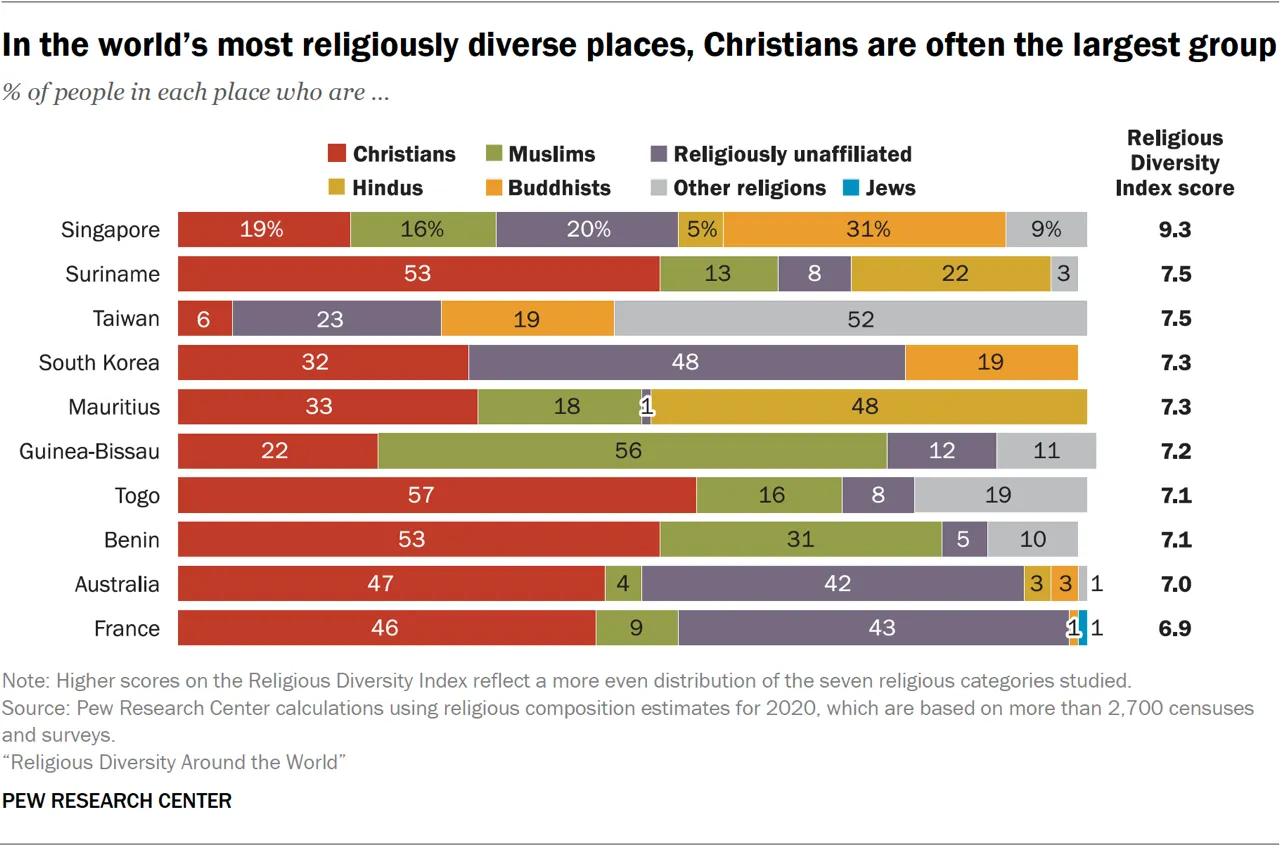
Pew, meanwhile, found the most religiously diverse places — and that they are often places where the biggest religious minority group is Christians.
Over at Bluesky, pathogen researcher Theo Sanderson put his skills to use mapping one of the most dangerous viruses known to man: social media. He created a cosmic map of the universe of Bluesky users, one that situates me a bit distant from the galaxy's center.

Different parts of the galaxy represent different communities within the app, and Sanderson's data correctly fixed me where I belong: near the digital preservationists, edutainers and Philadelphia Eagles fans.
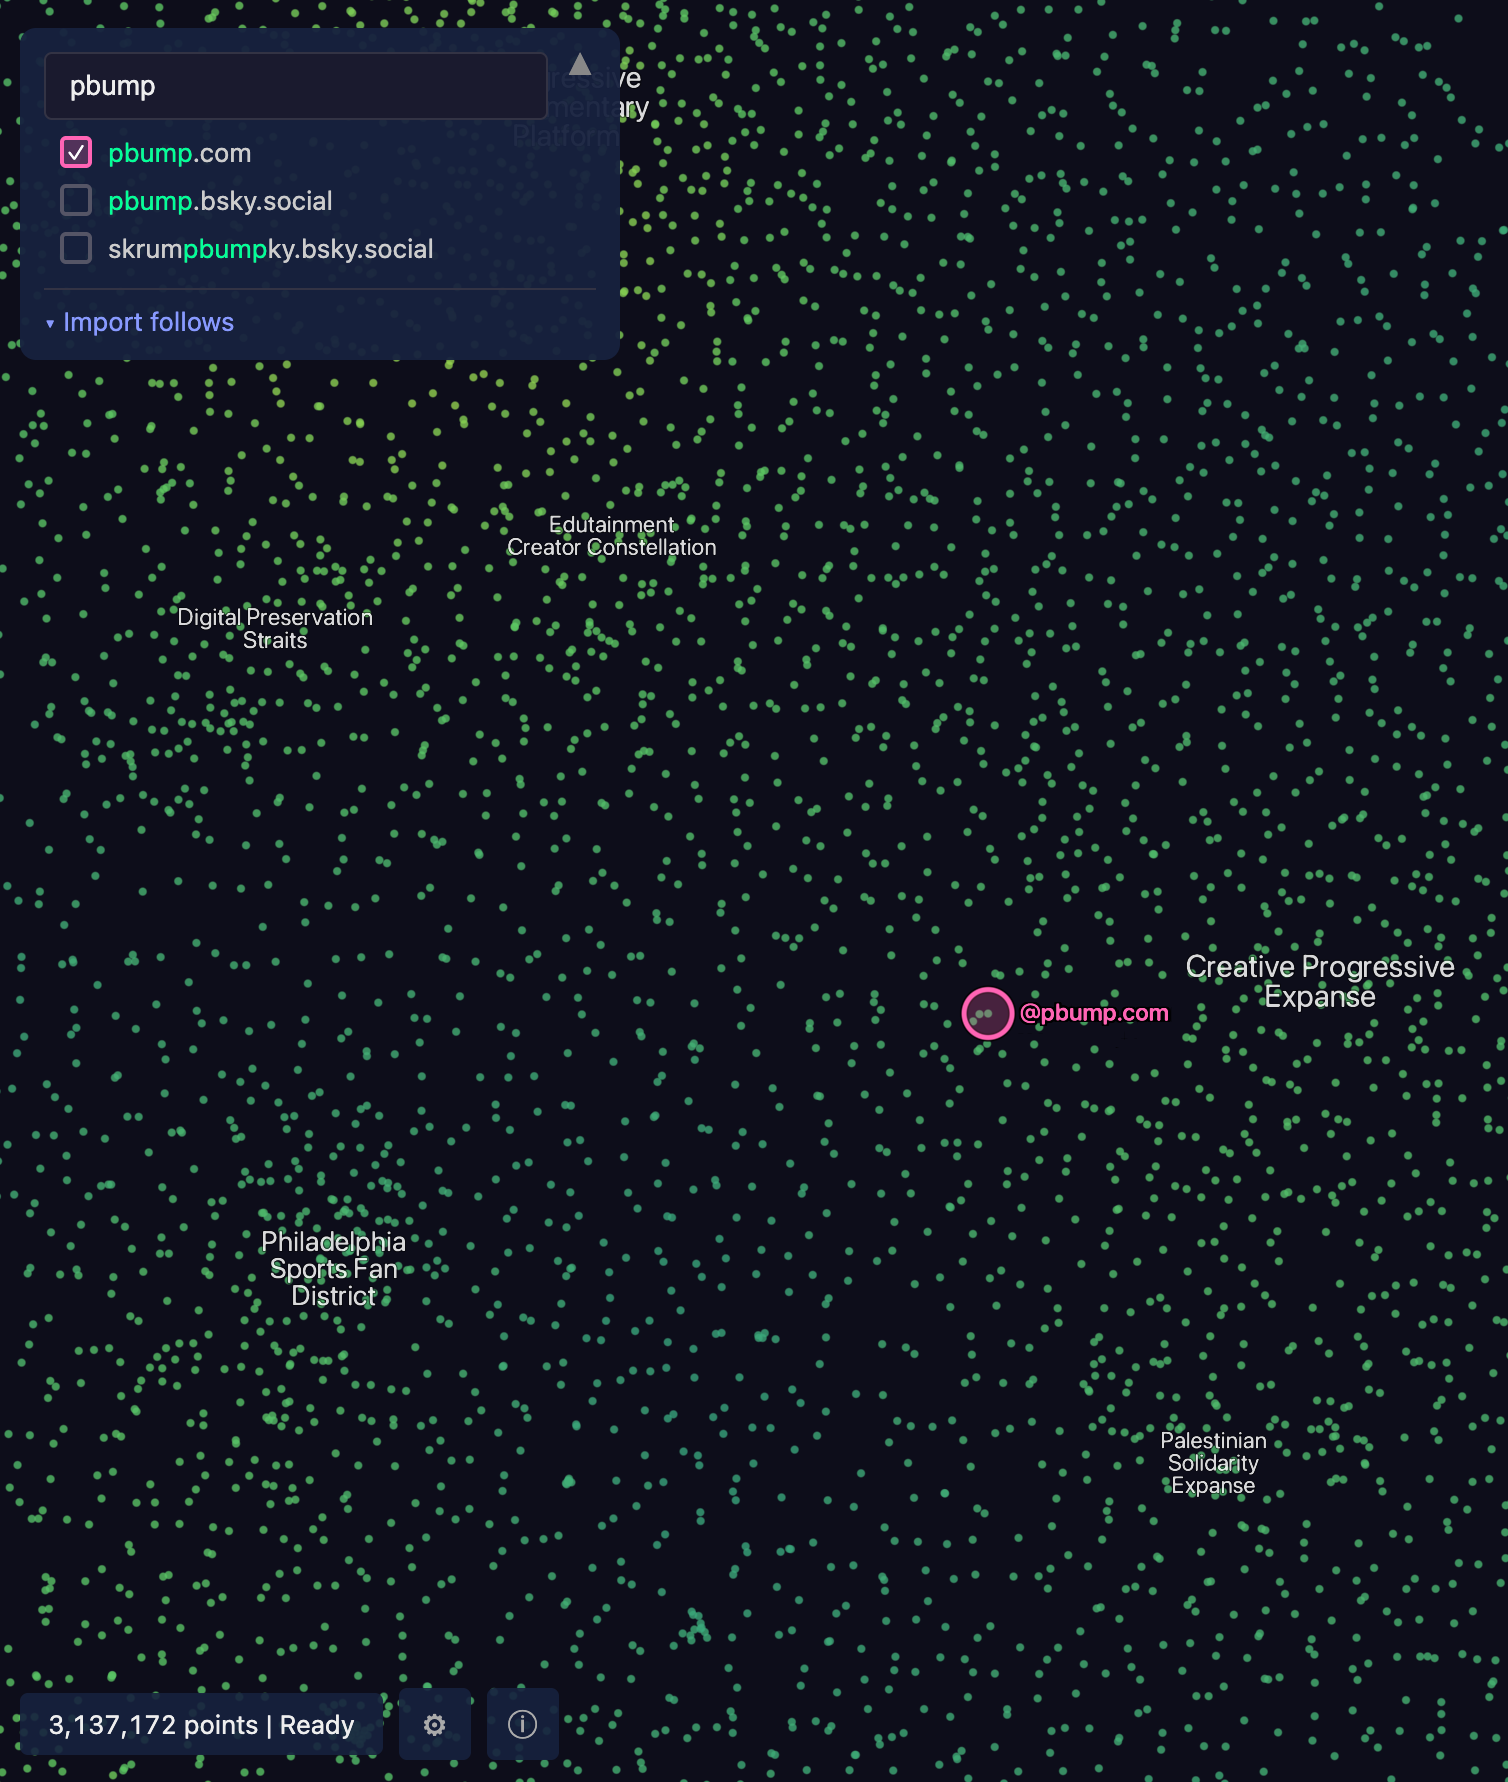
My wife does not appear on this map because she is not on Bluesky, and that is just one of the many reasons I love her.
Appendix
Some other things I've written
I had fewer things publish this week because some of them are being held for next week, when I'm mostly trying not to work. That holds for this newsletter, too — I'm planning for the next edition to be on the 28th, instead of the 21st. Please don't be sad! Today is a happy holiday (at least for 59 percent of Americans)!

You are receiving this email because you at some point in time volunteered to, either at Ghost or Substack or pbump.net or pbump.com. If you don't want to receive future emails, I'll assume it's because you no longer love me. What you really want to do is support the newsletter financially, right?
Another one is coming in two weeks. You have been warned.